Generate Reports
Upon configuration of both basic counting and advanced AI recognition functions, the device provides multiple data presentation options such as the dashboard, reports and command line outputs.
The device supports visual line chart or bar chart generation to display people traffic and supports report exporting. Before using this feature, do ensure that the device time is correct on System page. This function is available only in Master Mode and Standalone Mode.
Steps:
- In the main page, click Report from the left
navigation tree.
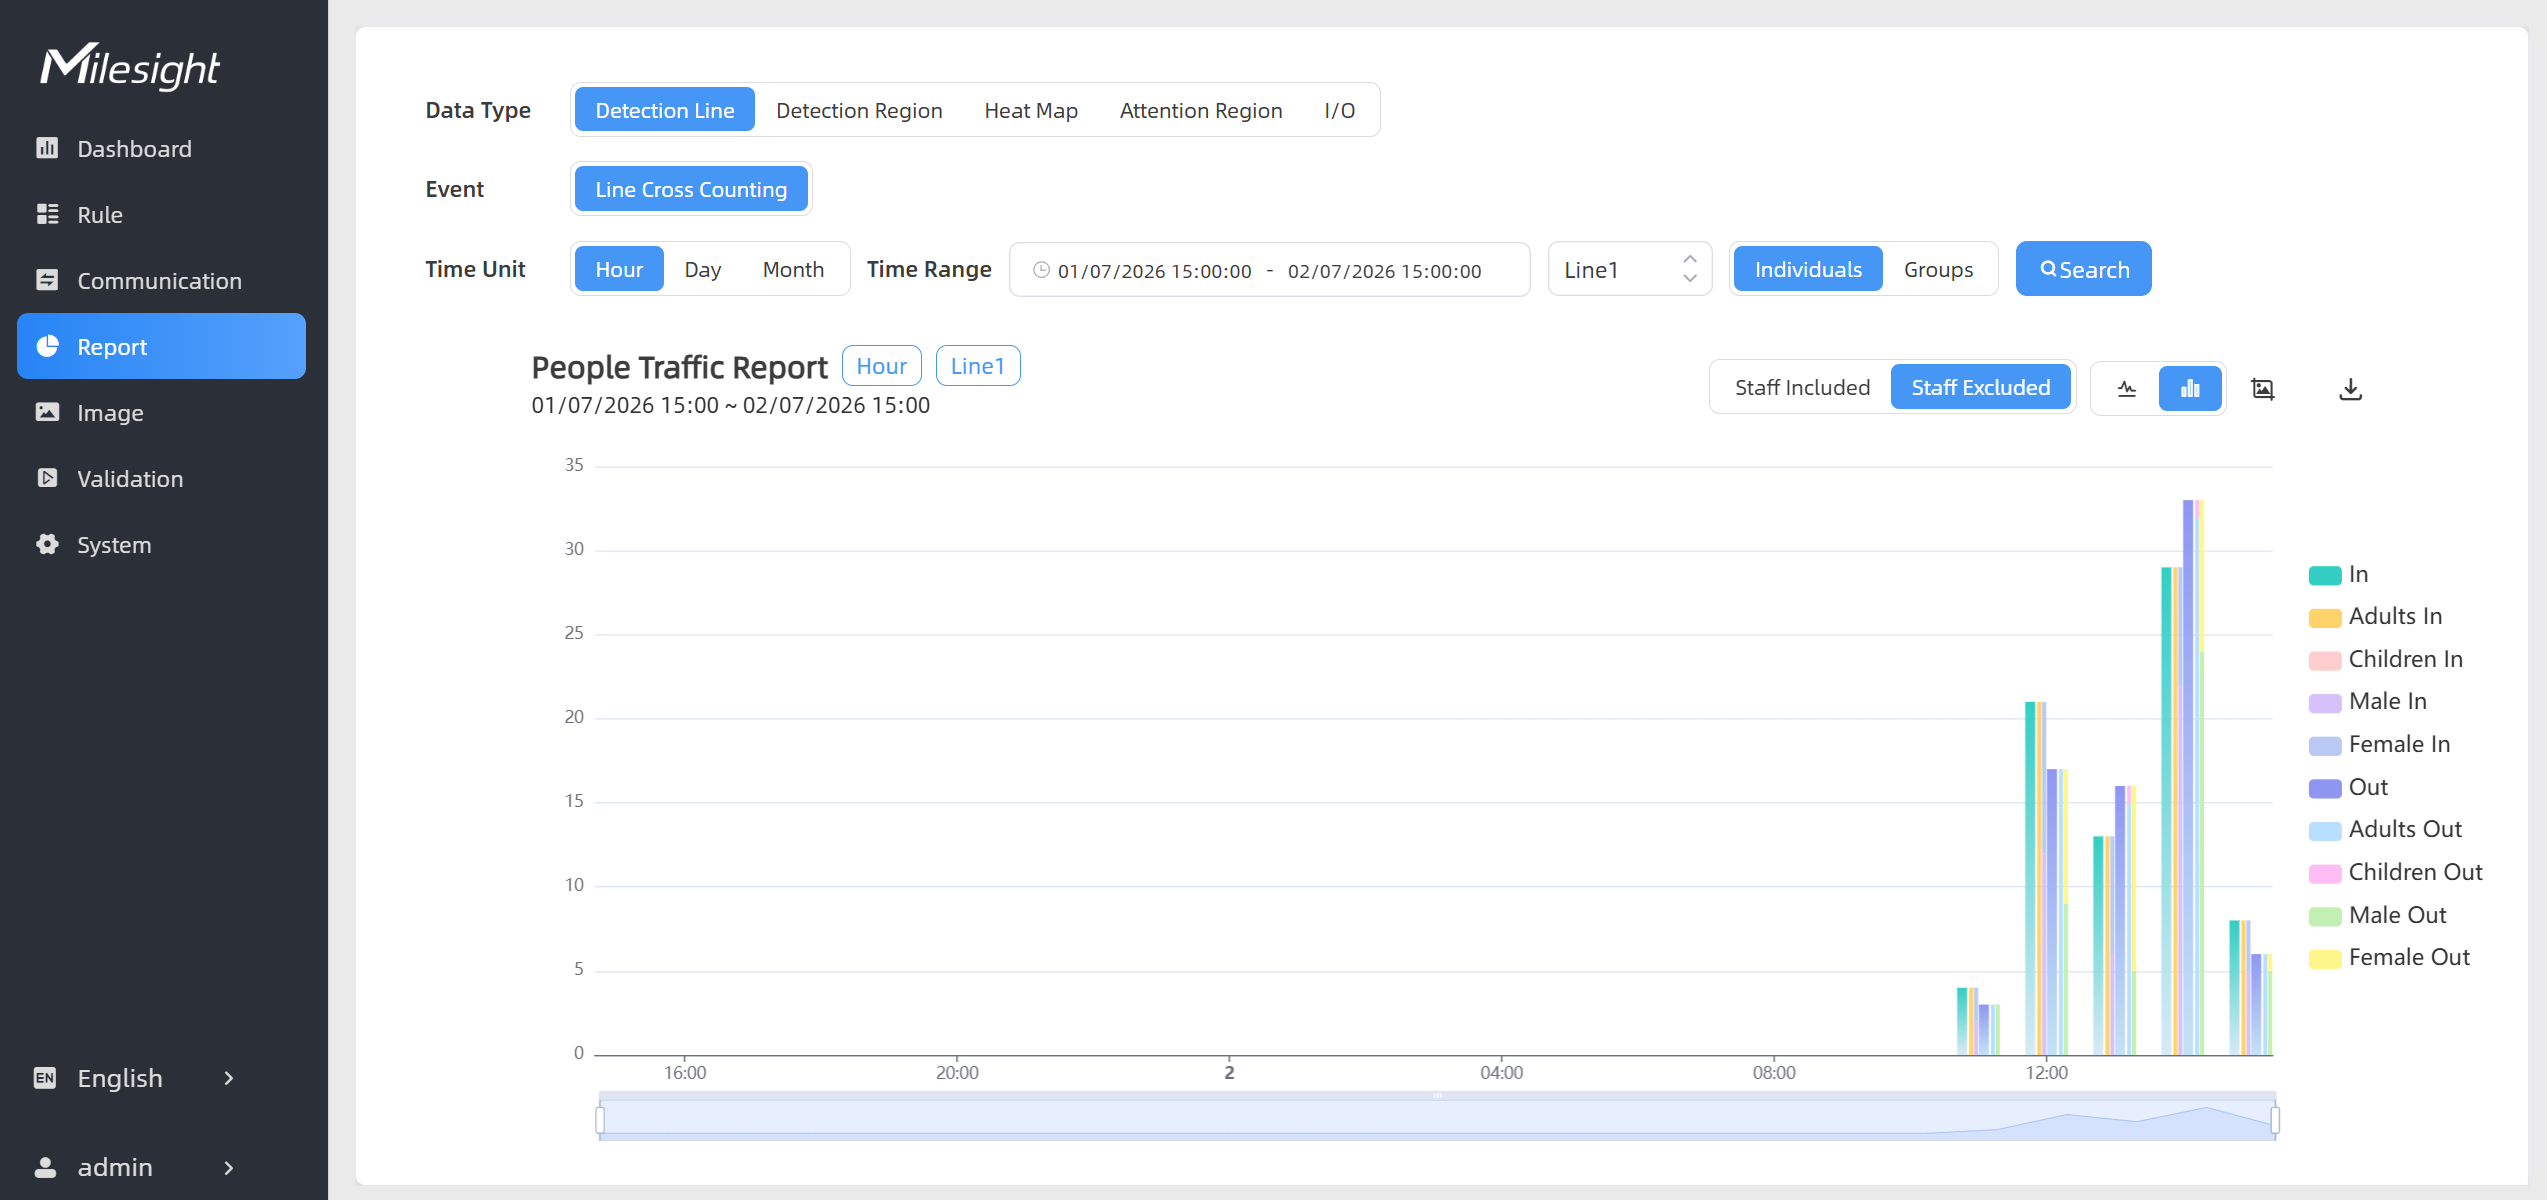
- Select the data type for report generation. Options: Detection Line, Detection Region, Heat Map, Attention Region, I/O.
- Perform any of the following operations as needed.
If Do If Data Type is set to Detection Line - Set Time Unit and Time Range.
- Select a line from the drop-down list.
- Select Individuals or Groups as needed.
- Click Search. The People Traffic Report is displayed correspondingly.
- Click Staff Included or Staff Excluded to include/exclude staff counting values in the report.
- Click
 or
or  to display the
report in the corresponding form.
to display the
report in the corresponding form. - Click
 to download
the chart screenshot.
to download
the chart screenshot. - Click
 to export the historical
traffic data to a CSV file. The system supports exporting up to 1,000,000
data records per CSV file.
to export the historical
traffic data to a CSV file. The system supports exporting up to 1,000,000
data records per CSV file. - Click on any category on the
following figure to hide it from the
chart.
If Data Type is set to Detection Region - Select an event. Options: Region People Counting, Single Dwell Time Detectionand Continuous Dwell Time Detection
- Perform any of the operations as
needed.
- If Event is set to Region People Counting: set Time Range and select a region from the drop-down list.
- If Event is set to Single Dwell Time Detection/ Continuous Dwell Time Detection: set Time Range, Min. Value, Bin Width and Number Of Bins and select a region from the drop-down list.
- Click Search. The People Counting Report or Total Dwell Time Report is displayed correspondingly.
- Click Staff Included or Staff Excluded to include/exclude staff counting values in the report.
- Click to download
the chart screenshot.
- Click to export the historical
traffic data to a CSV file. The system supports exporting up to 1,000,000
data records per CSV file.
- Click on any category on the
following figure to hide it from the
chart.
If Data Type is set to Heat Map - Select an event. Options: Motion Heatmap, Dwell Heatmap.
- Set Time Range.
- Click Search. The Motion Heatmap Report or Dwell Heatmap Report is displayed correspondingly.
- Click to download
the chart screenshot.
- Click
 to refresh image.
If Data Type is set to Attention Region - Set Time Range, Min. Value, Bin Width, and Number Of Bins and select an attention region.
- Click Search. The Attention Time Report is displayed correspondingly.
- Click Staff Included or Staff Excluded to include/exclude staff counting values in the report.
- Click or to display the
report in the corresponding form.
- Click to download
the chart screenshot.
- Click to export the historical
traffic data to a CSV file. The system supports exporting up to 1,000,000
data records per CSV file.
- Click on any category on the
following figure to hide it from the
chart.