4.3.2 Heat Map
You can get Heat Map and backup them on this interface of panoramic series.
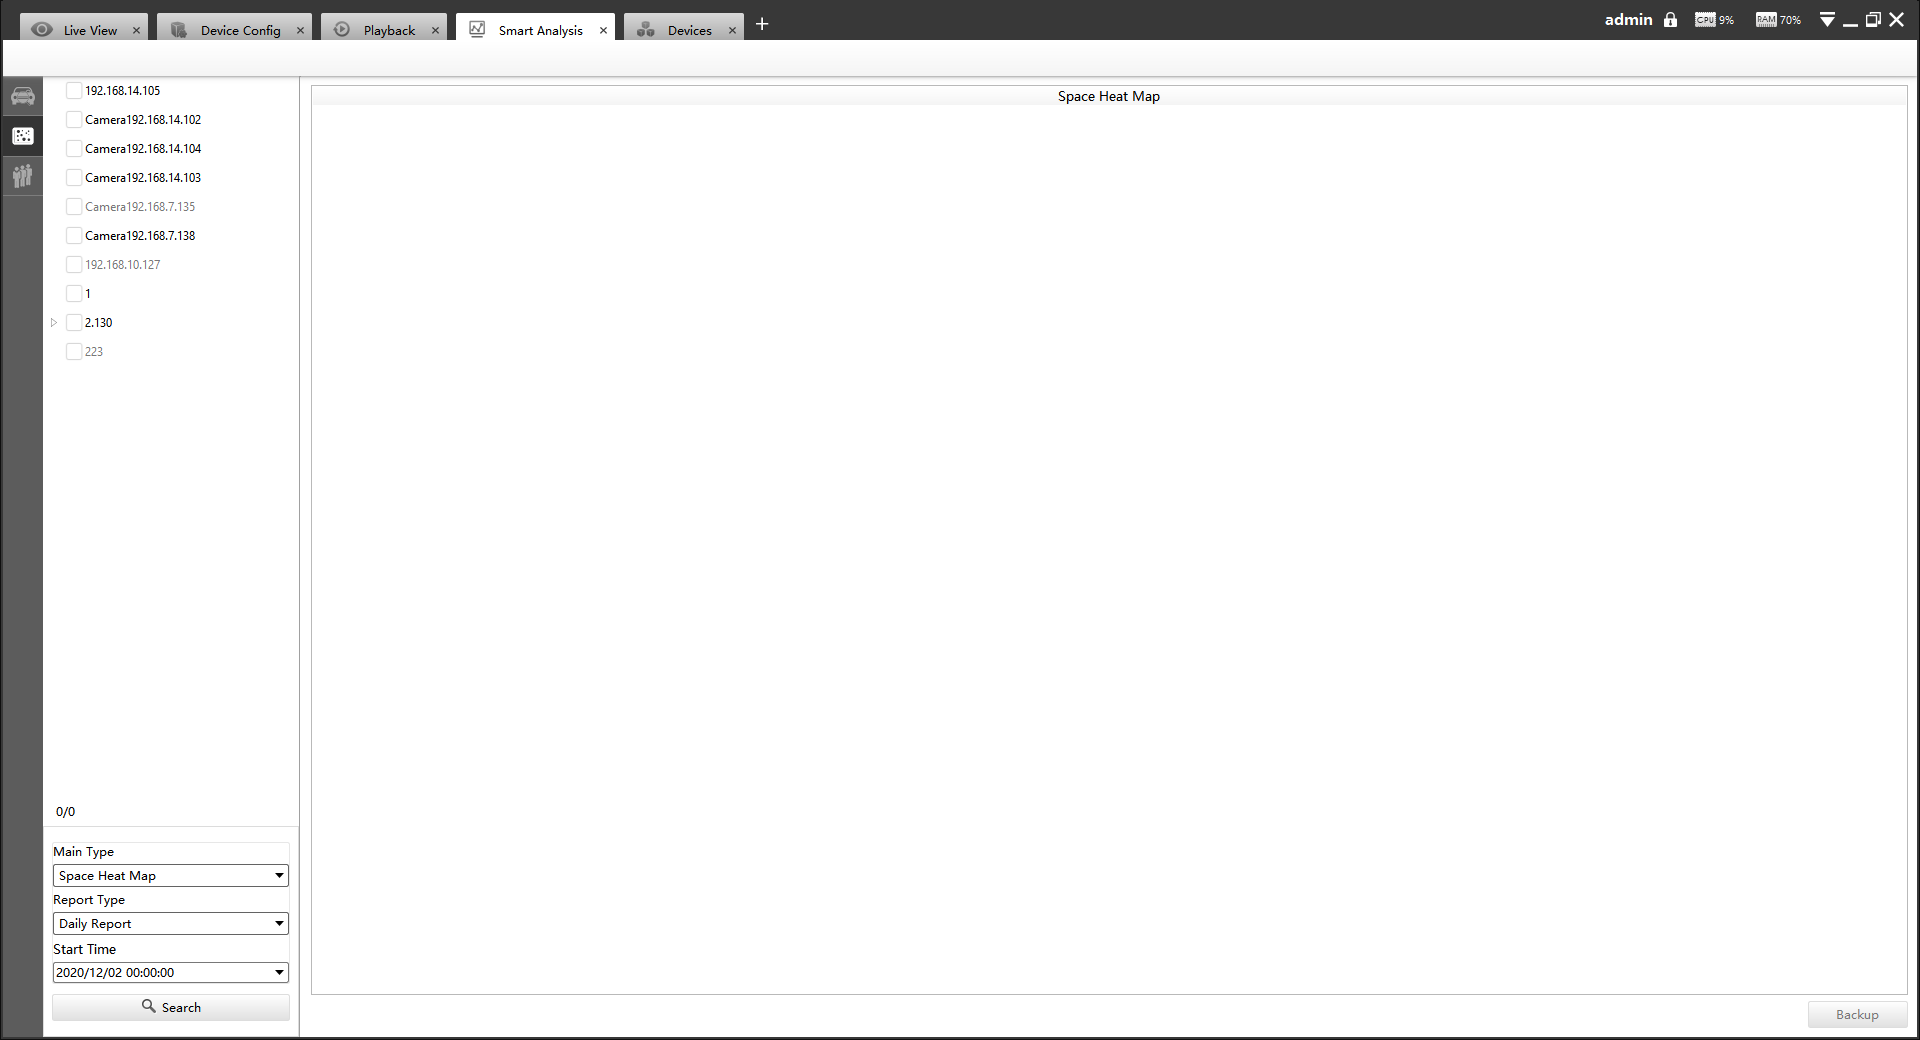
Step1:Select Main Heat Map Type;
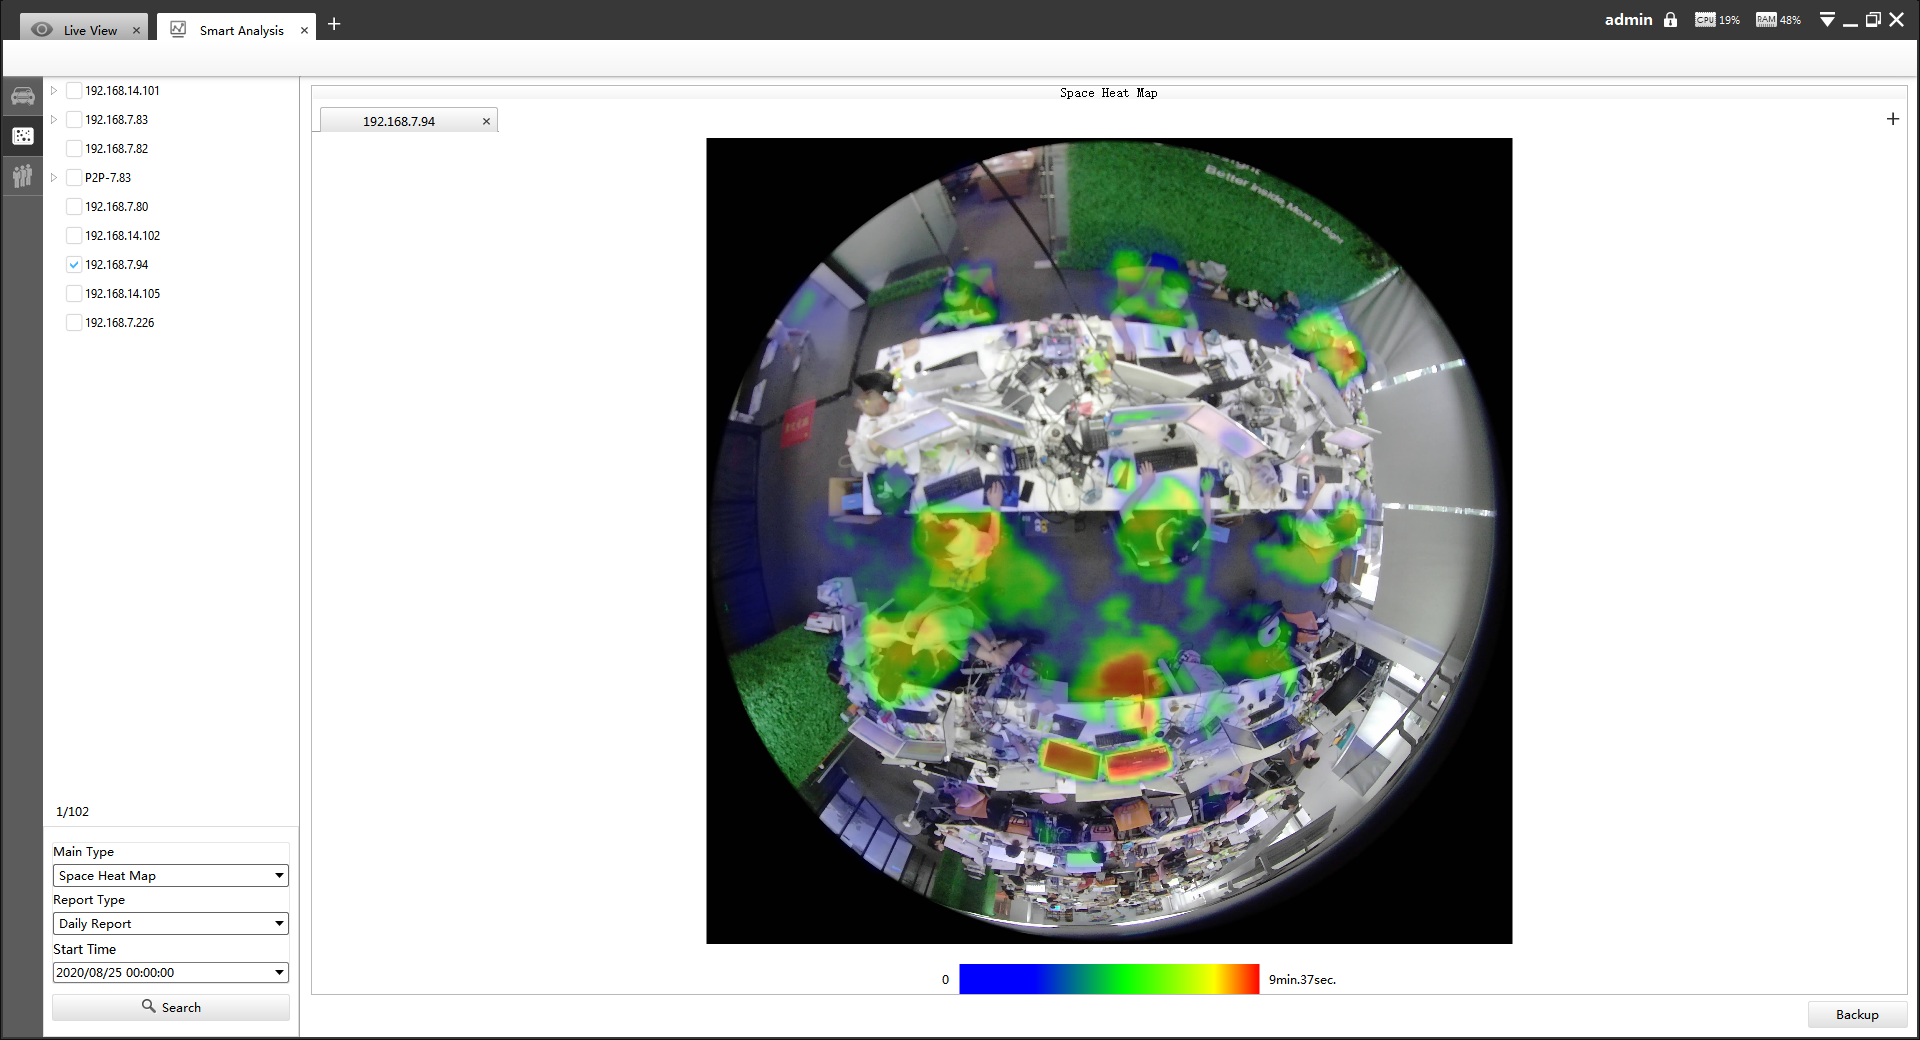
[Space Heat Map]: Space Heat Map will be presented as a picture with different colors. Different colors represent different heat values. Red represents the highest and blue represents the lowest.
[Time Heat Map]: Time Heat Map will be presented as a line chart to show the heat at different times.
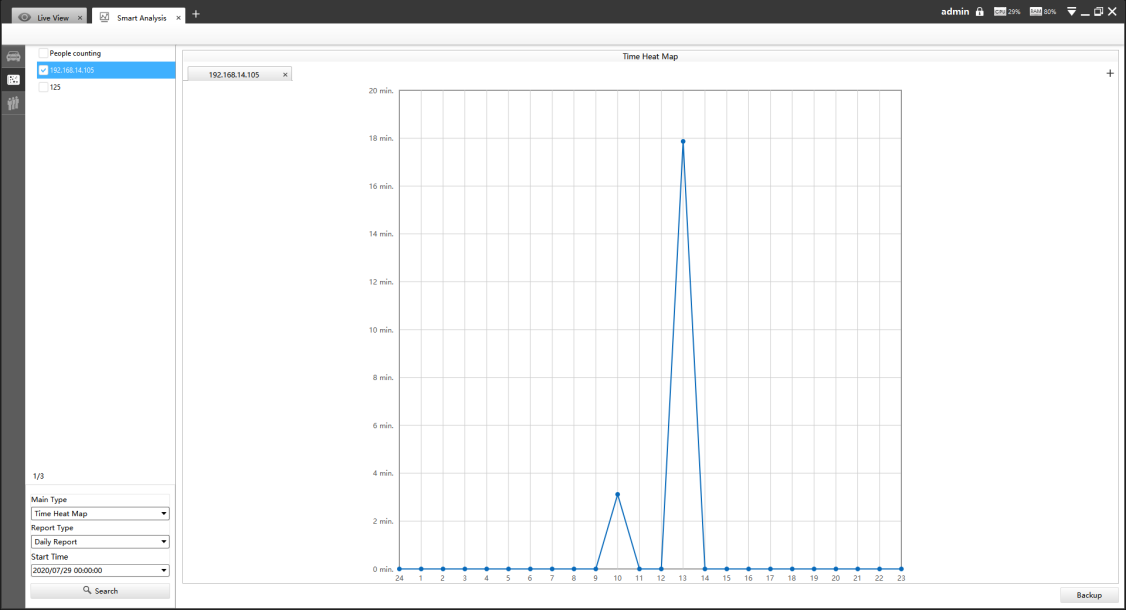
Step2:Select Report Type including Daily Report, Weekly Report, Monthly Report and Annual Report;
Step3:Select Start Time, then click the “Search” button. The camera will automatically count the data for the day/week/month/year (based on the report type selected by the user) from the start time and generate the corresponding report;
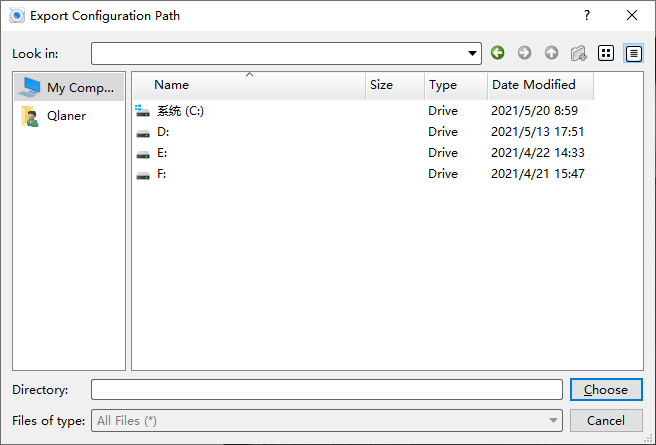
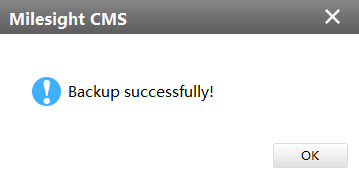
Step4:Click “Backup”button, then choose a file path and report type to export. When the window pops up as shown below, the backup is completed.