Configure Heat Map
This section describes how to configure Heat Map function.
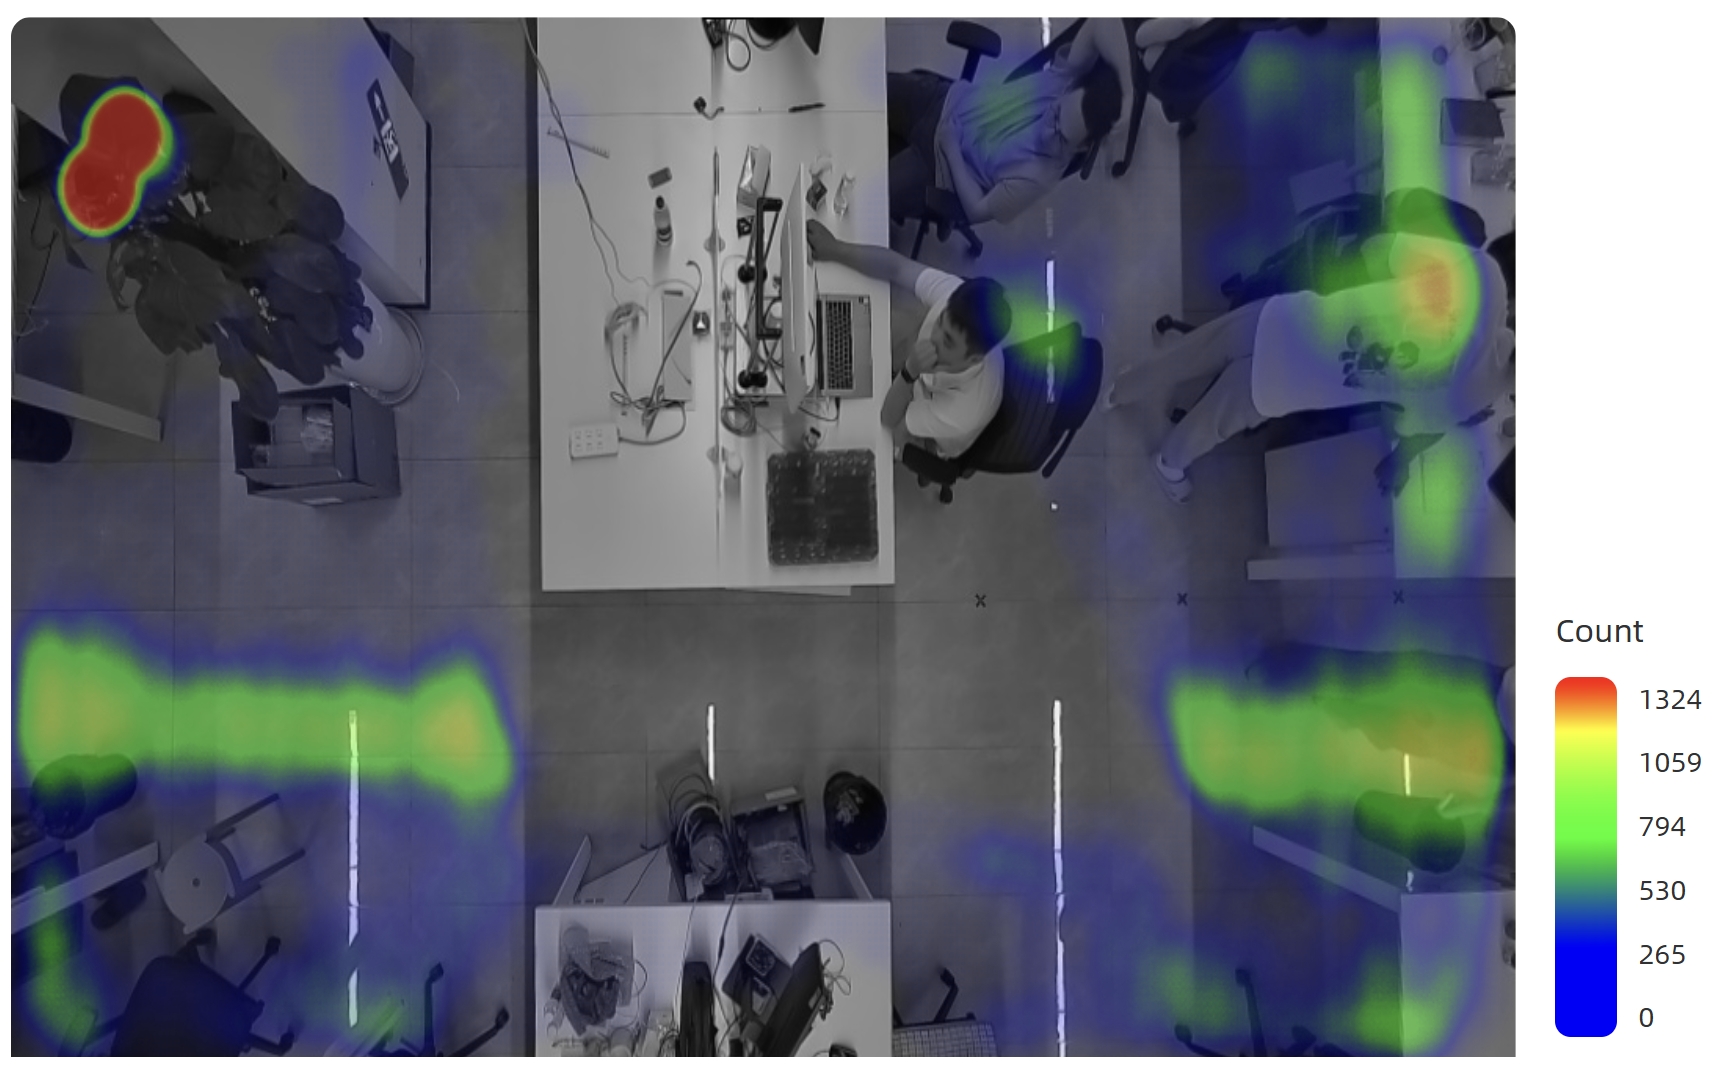
The Heat Map function analyzes personnel movement and dwell time data and displays the analytical results through color-coded temporal or spatial visualizations. This provides insights for better business management.
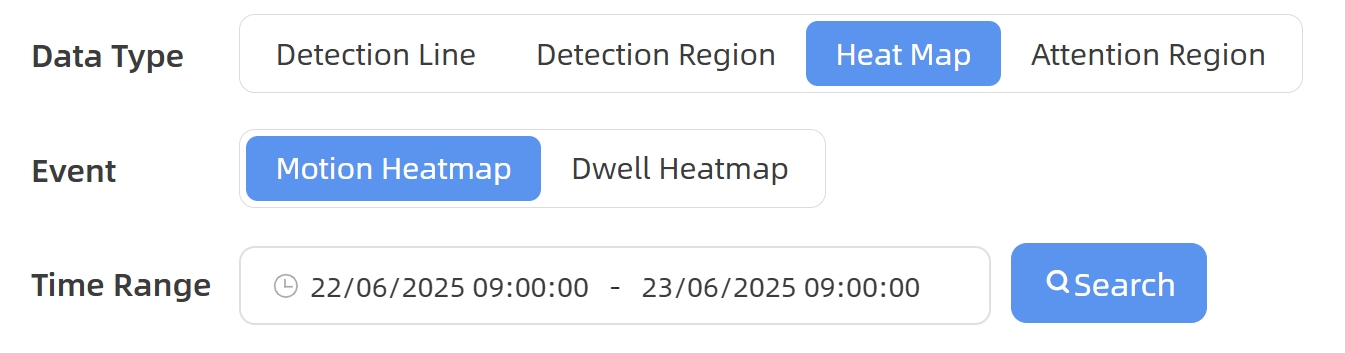
The device supports Motion Heatmap and Dwell Heatmap. Motion Heatmap visualizes areas with the highest pedestrian traffic density, while Dwell Heatmap visualizes the areas with the maximum occupant dwell duration.
Steps:
- Enable the Heat Map function.
- View the heat map data for a certain time period and
generate the corresponding report, click Report from the left
navigation tree. For
details, refer to Generate Reports.