Report
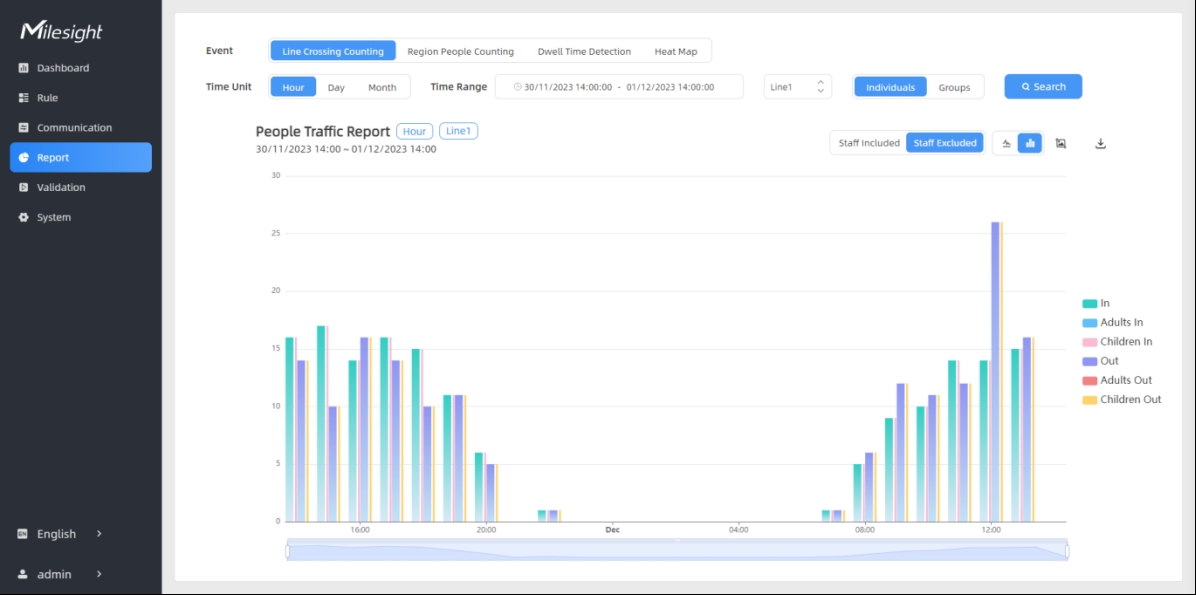
The device supports visual line chart or bar chart generation to display people traffic and supports report exporting. Before using this feature, do ensure that the device time is correct on System page.
| Parameters | Description |
|---|---|
| Event | Select the event which you want to query
the report. Line crossing counting, region people counting, dwell time
detection and heat map are optional. When "regional people counting" is selected, it may take up to 30 seconds to retrieve data from a long time period, with a maximum of 20,000 records available at once. |
| Time Unit | Select the unit to generate the graph or export the data. |
| Time Range | Select the time range to generate the graph. |
| Report Type | For heat map report, Motion Heatmap and Dwell Heatmap are optional. |
 |
Click to generate or refresh the graph according to the previously selected option. |
 |
Select whether to include staff counting values on the graph. |
 |
Select the display type as line or bar. |
| Click to download the chart screenshot. | |
| Export the historical traffic data as CSV file according to the selected option. The device can store up to one million data records to CSV file. | |
 |
The chart displays multiple data types. Click on any category will hide it from the chart. |
Note: When working mode is on Node
mode, the device will not generate this report.