Line Crossing Counting
Users can draw detection lines to count the number of people entering or exiting.
- Ensure that the detected target can pass through the detection line completely. It’s recommended that the detection line is perpendicular to the In/Out direction and on the center of the detection area without other objects around.
- Redundant identification spaces are needed on both sides of the detection line for the target detection. This ensures stable target recognition and tracking before crossing the detection line, which will make the detection and count more accurate.
- It is recommended to draw the detection line as close to the center of the image as possible, and ensure that the target has already been detected before crossing the line.
Step 1: Please ensure that the deployment parameters and device strategies have been configured before using this feature.
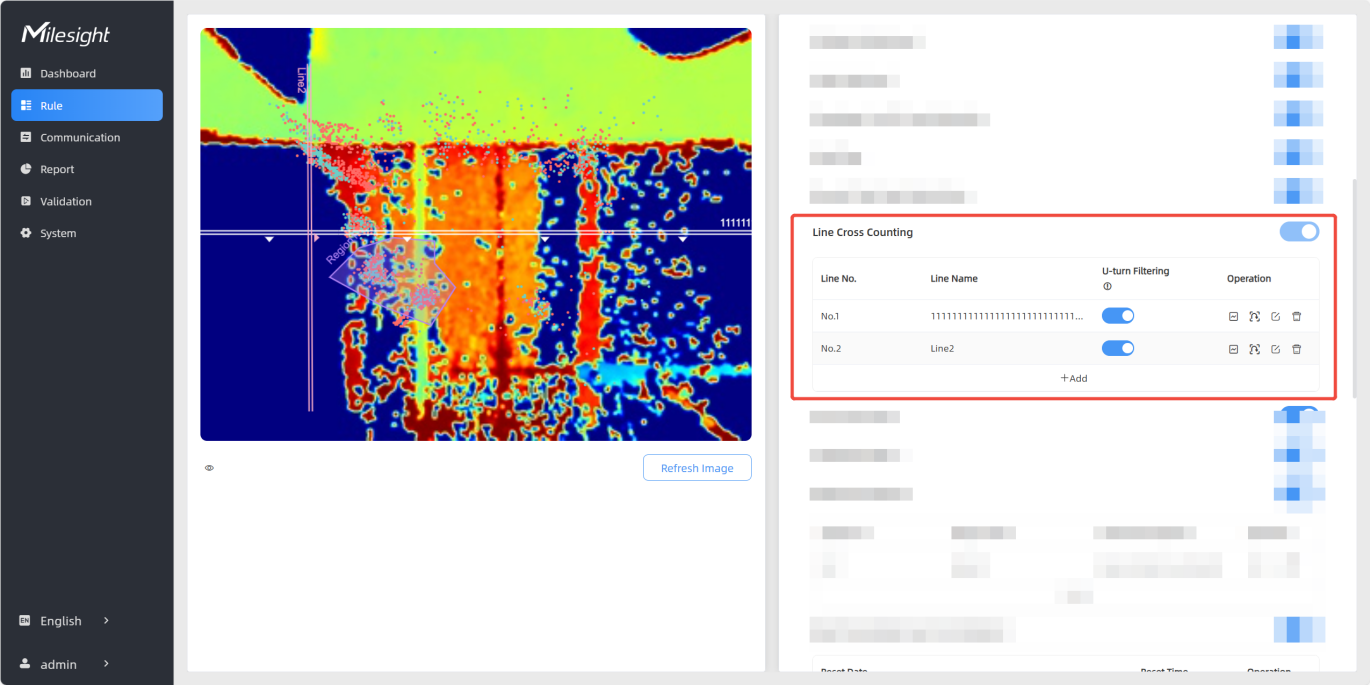
Step 2: Find the list of detection lines. Click +Add to draw a new
detection line or click![]() to edit the existed detection line on the live
view.
to edit the existed detection line on the live
view.
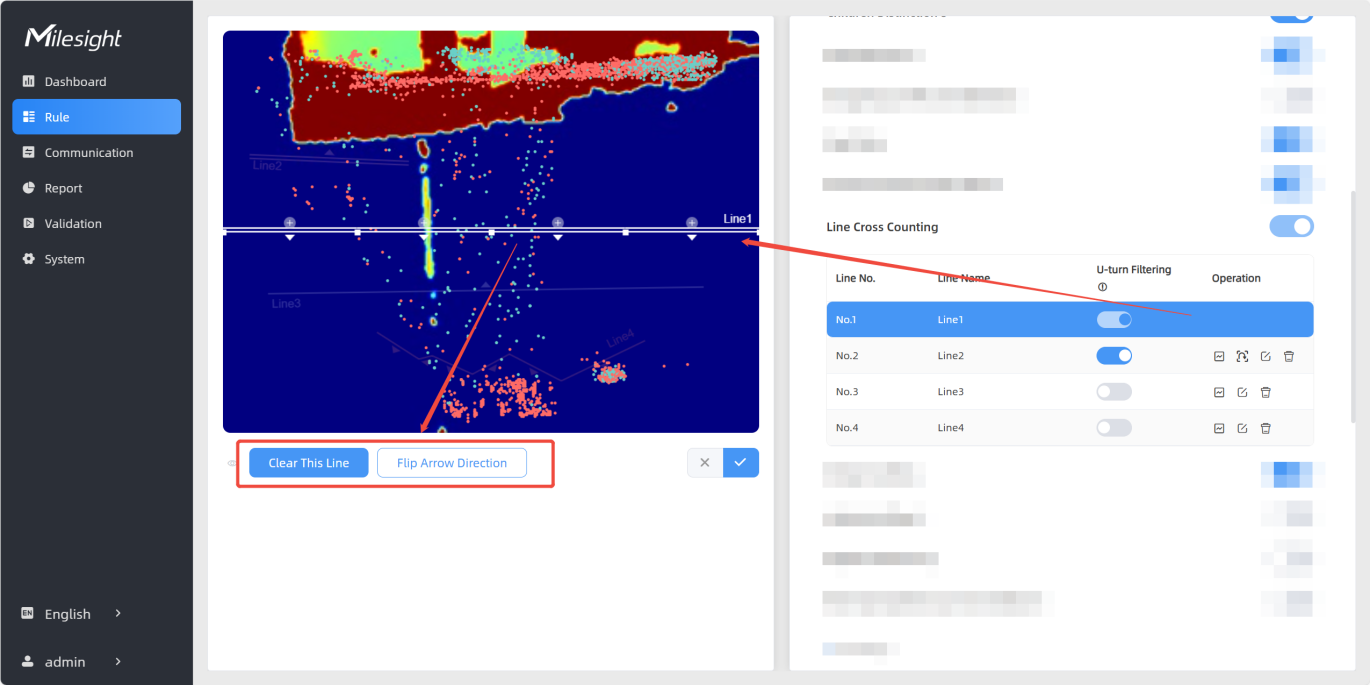
Step 3: Left-click to start drawing and drag the mouse to draw a line, left-click again to continue drawing a different direction edge, and right-click the mouse to complete the drawing. The line can be dragged to adjust the location and length. One device supports at most 4 broken lines with maximum 10 points each.
Step 4: If users want to redraw this line, click Clear This Line or drag
the vertices of the broken line to adjust. The arrow direction of the detection line
depends on your drawing direction. If users need to flip the line, click
Flip
Arrow Direction. Then click ![]() to finish drawing.
to finish drawing.
Step 5: Users can click![]() to customize the name of line. If
users need to delete a certain line, click
to customize the name of line. If
users need to delete a certain line, click ![]() .
.
| Parameters | Description |
|---|---|
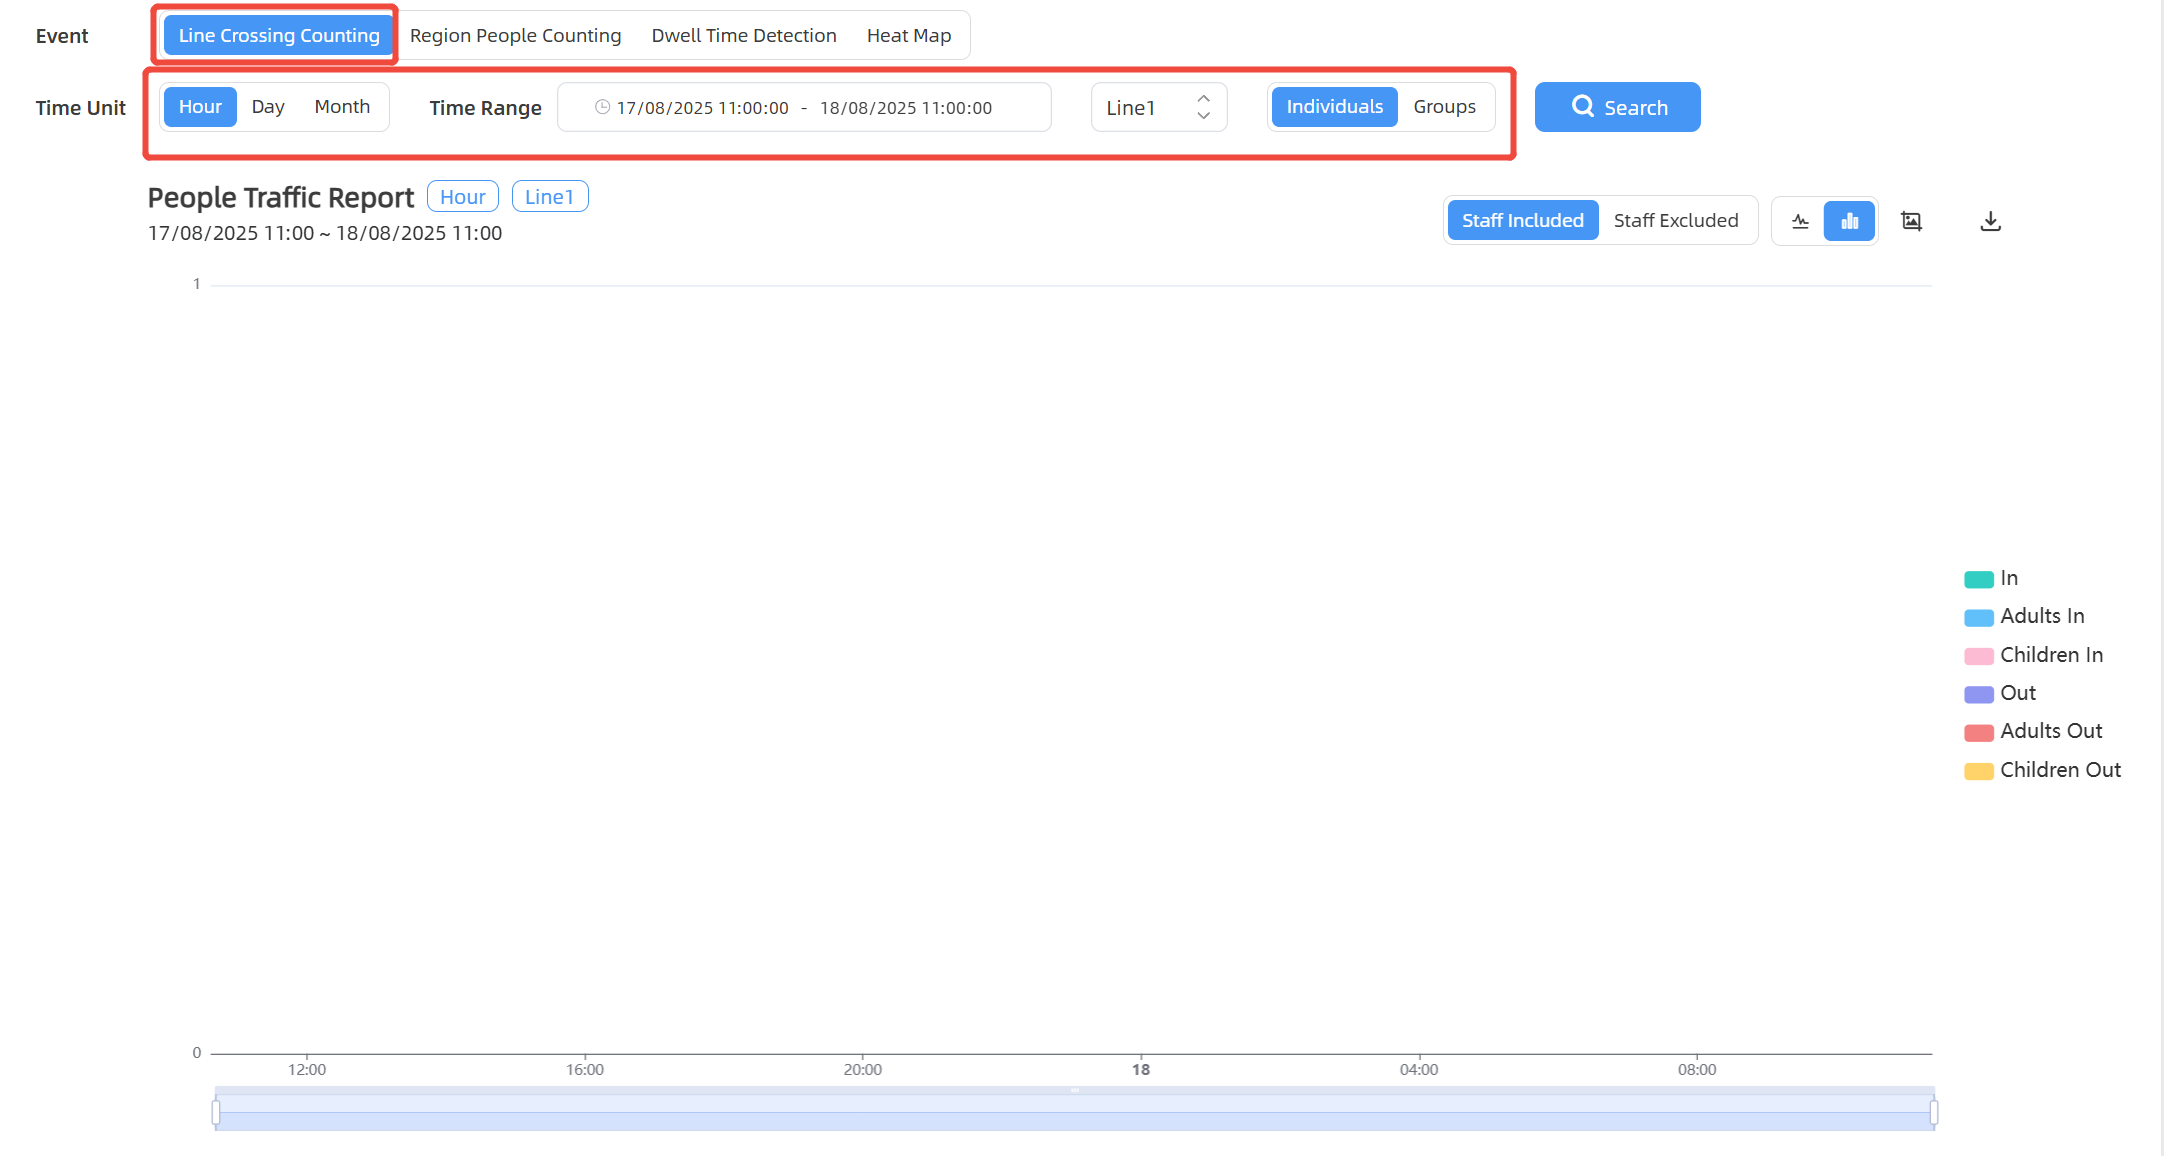
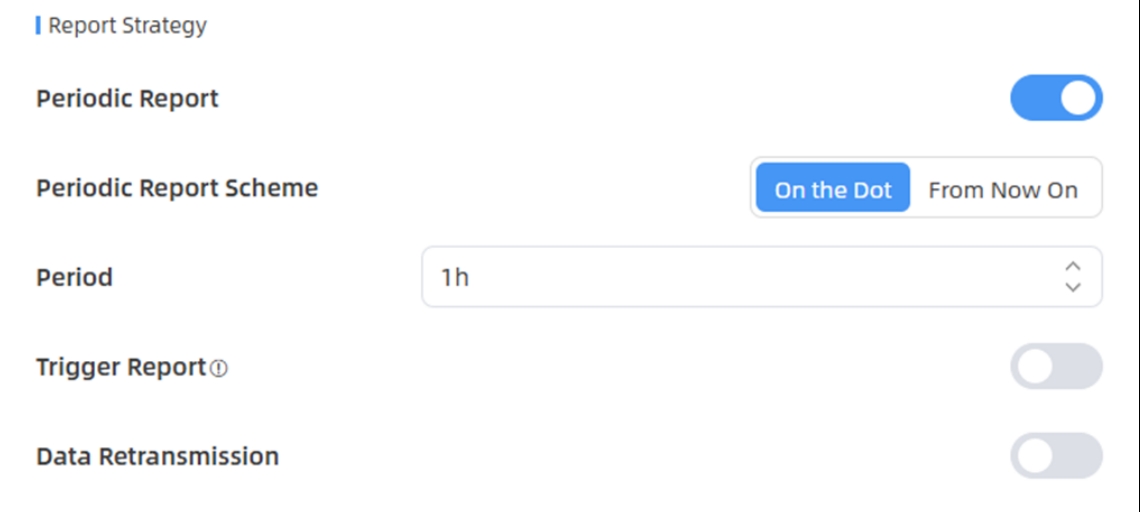
| Periodic Report | Regularly report the number of people counted crossing a line or within a region based on time. |
| Periodic Report Scheme | Select the periodic
report of "On the Dot" or "From Now On". On the Dot: Report at each integer moment. For example, current time is 0:07, when the interval is set to 10 minutes, it will report at 0:10, 0:20, 0:30, and so on. From Now On: Begin reporting from this moment onwards and regularly report based on the interval cycle. |
| Period | |
| Trigger Report | Report immediately when there is a change of the line crossing people counting number or region people counting number. For detailed report information, please refer to the Trigger Report. |
| Data Retransmission | Enable this feature to ensure the
network server can receive all data even if the network is down for
some time. The device supports up to 4000 historical records.
Before using this feature, please follow below steps to complete the relevant prerequisites: Step 1: Ensure the device time is correct. Please refer Time Configuration to sync the time Step 2: Go to Communication > LoRaWAN
to enable rejoin mode and set the number of packets sent. 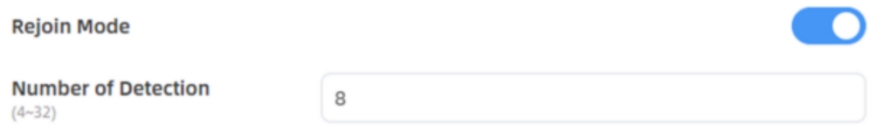 For example, the device will send LinkCheckReq MAC packets to the network server regularly to check any network disconnection; if there is no response for 8+1 times, the join status will change to de-active and the device will record a data lost time point (the time it reconnected to the network). Step 3: Ensure the device is always on-line and unplugged. After the network connection is restored, the device will send the lost data from the point in time when the data was lost according to the data retransmission interval (600s by default). Note:
|