Line Crossing Counting
Line Crossing Counting uses a virtual line to accurately count people entering and exiting, with direction detection. It is suitable for entrances, passageways, and partitions. Enable this feature if you need to track the number of people entering or leaving an area, manage access, or distinguish the direction of foot traffic.
Step 1: Go to People Counting → Line Crossing Counting, to enable line crossing counting feature.
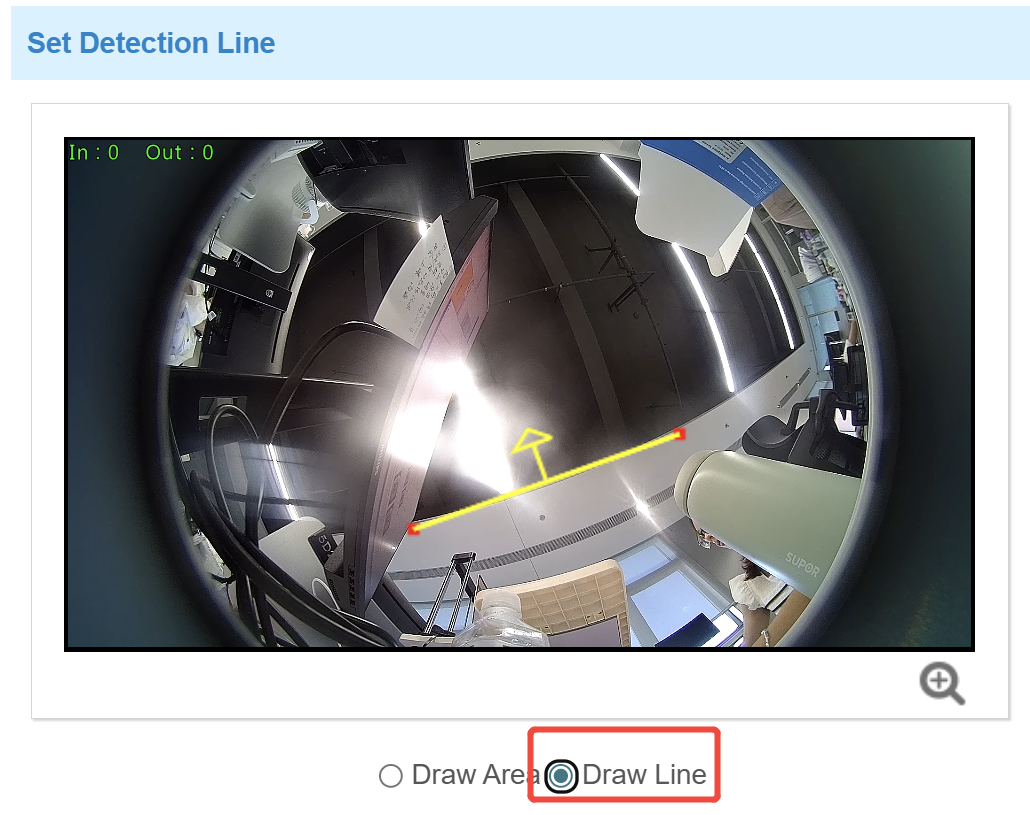
- The arrow direction of the detection line depends on your drawing
direction.
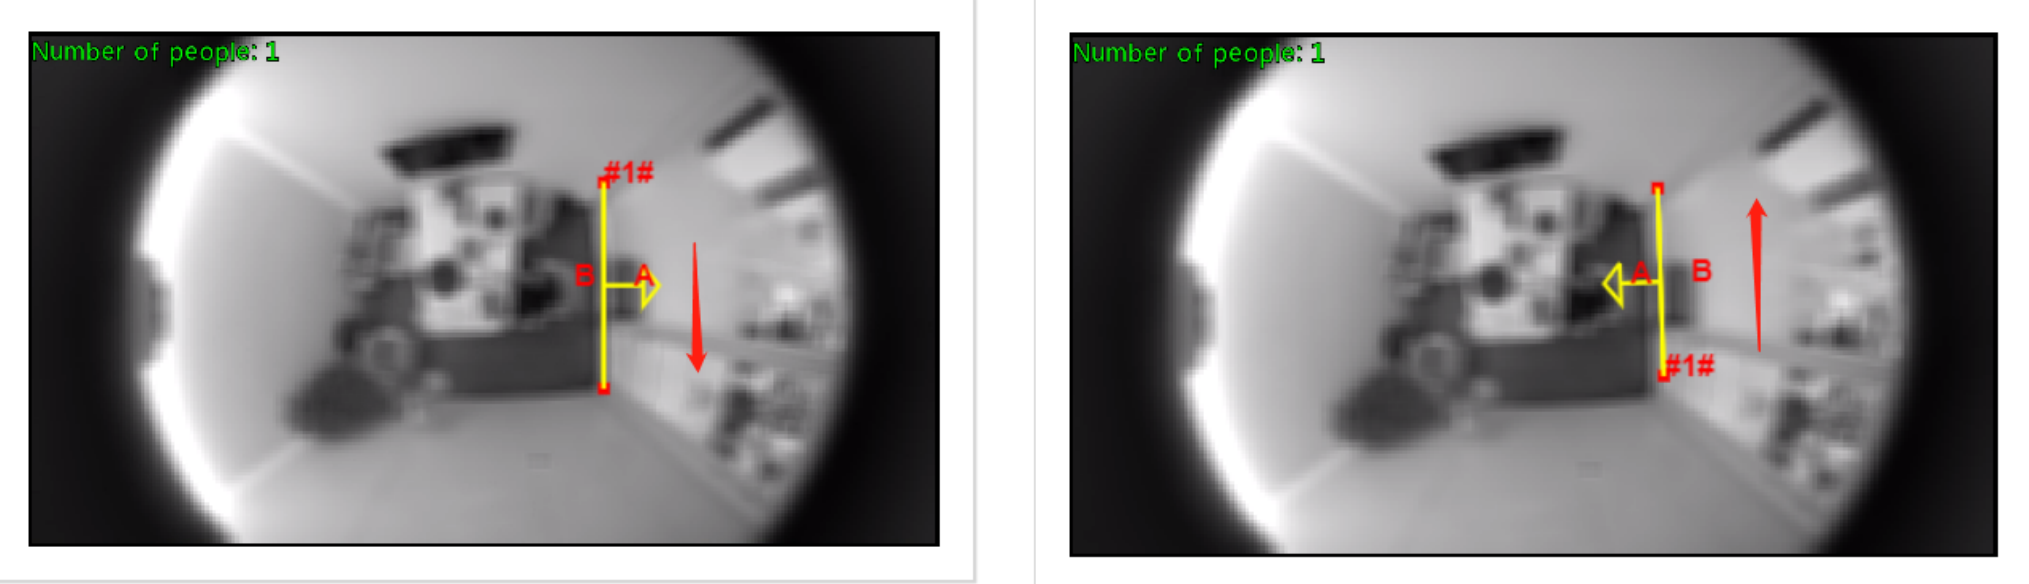
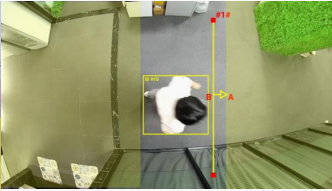
- Ensure that the detected targets can pass through the detection line completely.
It’s recommended that the detection line is perpendicular to the In/Out
direction and on the center of detection area without other objects
around.
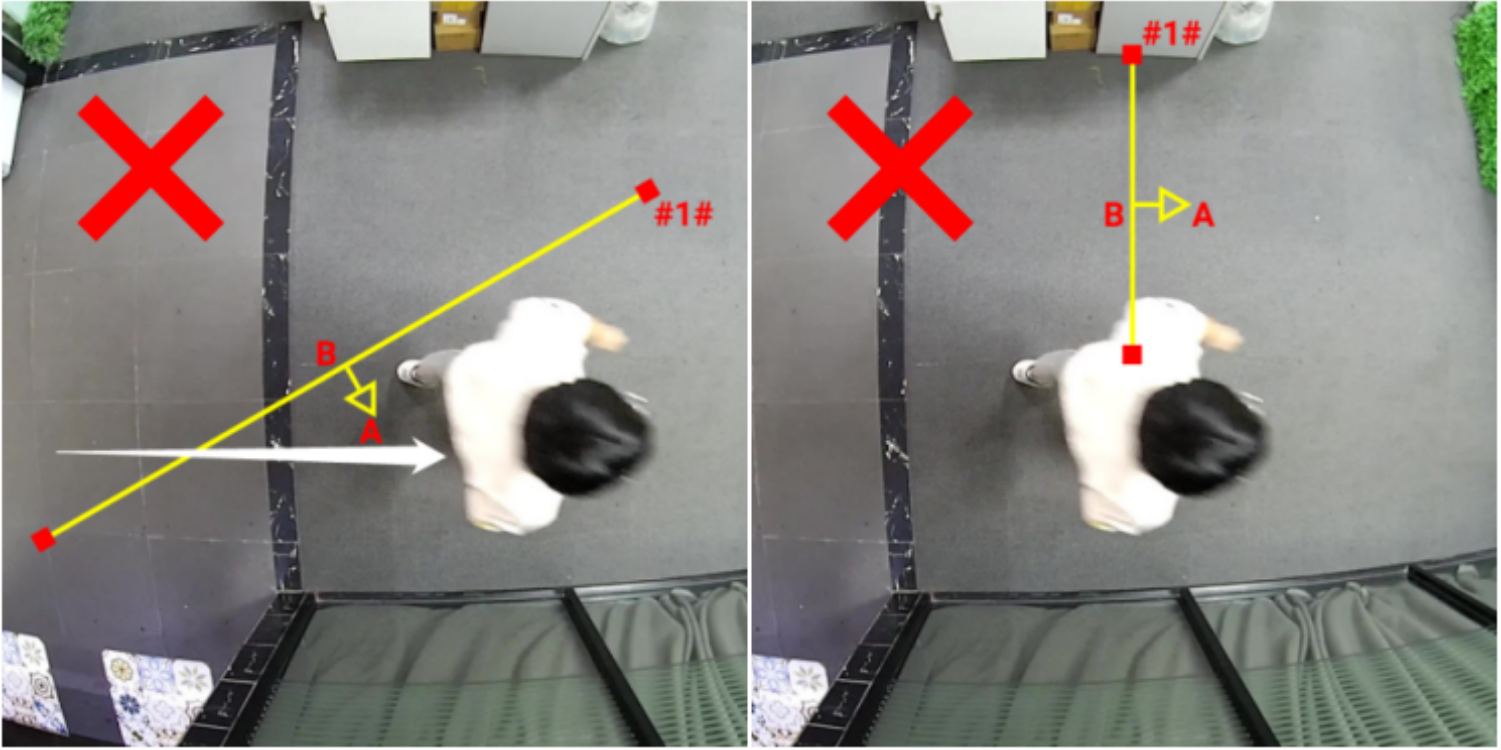
- A redundant identification area needed to be left on both sides of the detection
line for the target. This is to ensure that the sensor has stable recognition
and tracking of this target before it passes the detection line, which will make
the detection and count more accurate.
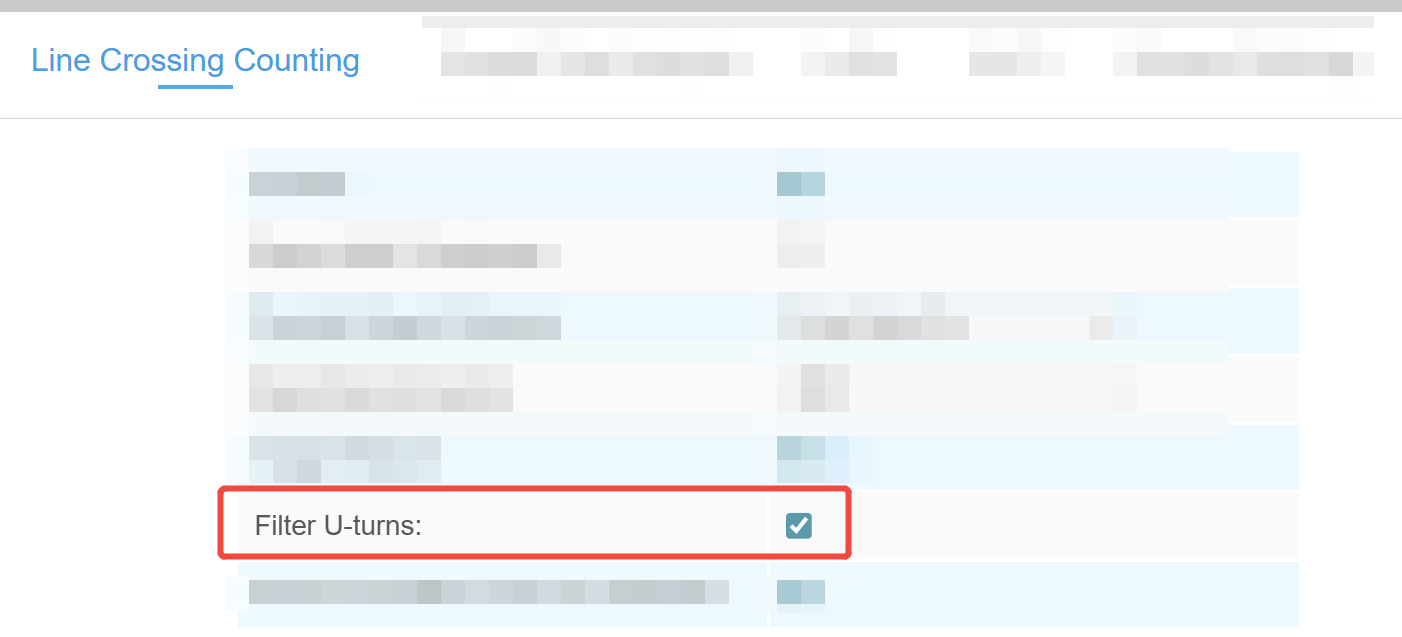
Step 3: The device supports the Filter U-turns function, filtering out the people who are actually not entering or exiting the entrance, to avoid repeated counting. If you don't have a need to filter out people, skip this step.
-
- Enable Filter U-turns, navigate to the live view at the bottom of
the page, and click Draw Area to draw a area around the detection
line. People who remain or loiter within this area will not be included
in the count. You can click
 to zoom in on the display.
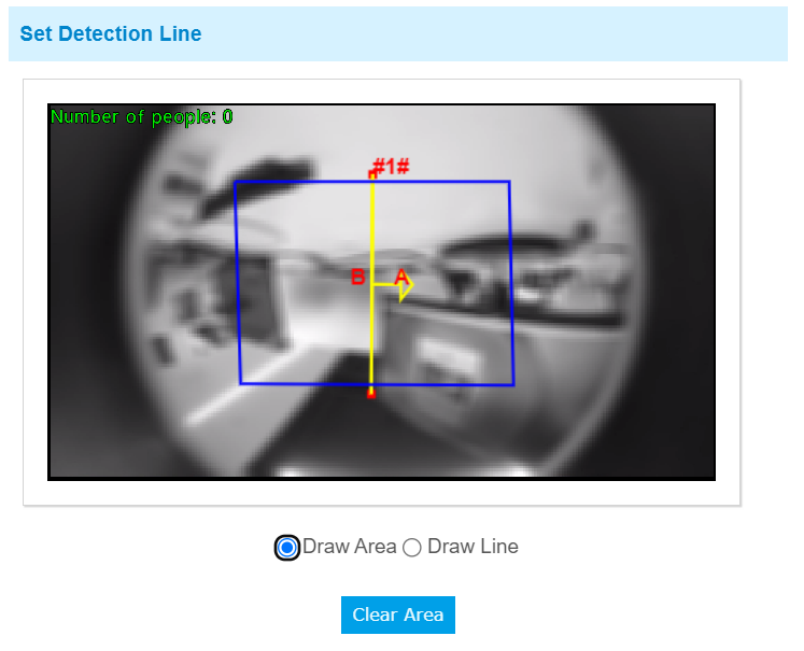
- Left-click to start drawing and drag the mouse to draw an edge. Then left-click again to continue drawing an edge in a different direction. Right-click the mouse to complete the drawing. The area can be dragged to adjust the location and length.
- Click OK to finish drawing.
- Enable Filter U-turns, navigate to the live view at the bottom of
the page, and click Draw Area to draw a area around the detection
line. People who remain or loiter within this area will not be included
in the count. You can click
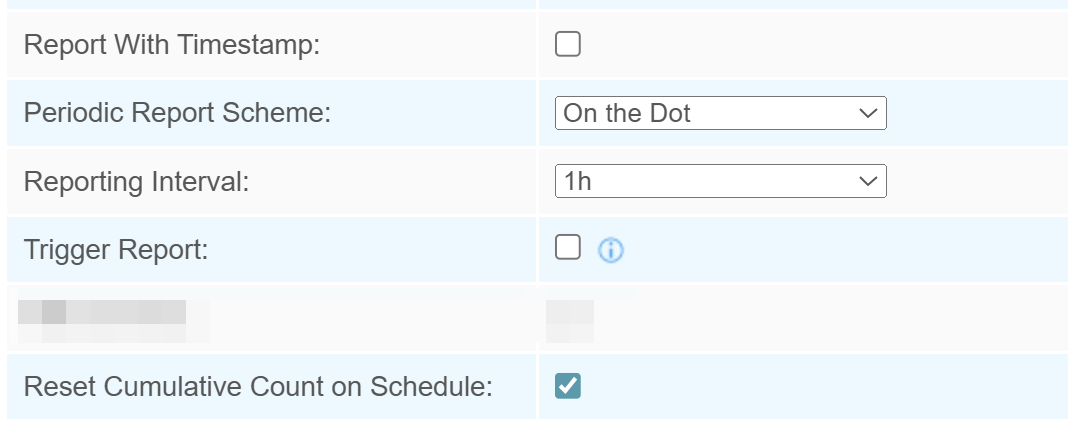
Step 4: Report setting.
| Parameters | Description |
|---|---|
| Report with Timestamp | Report the data with timestamp. |
| Periodic Report Scheme | Select the periodic report
of "On the Dot" or "From Now On". On the Dot: Report at each integer moment. For example, current time is 0:07, when the interval is set to 10 minutes, it will report at 0:10, 0:20, 0:30, and so on. From Now On: Begin reporting from this moment onwards and regularly report based on the interval cycle. |
| Reporting Interval | |
| Trigger Report | Report immediately when there is a
change of the line crossing people counting number. Any further
crossings within 15 seconds are accumulated and reported together at the
end of the 15-second period. Note: Please set the
periodic reporting interval to over 30 seconds when both trigger and
periodic reporting are enabled. |
| Reset Cumulative Count on Schedule | Enable to periodically reset cumulative
line cross counting values on schedule. Support up to 5 reset
schedules. Whenever you modify a reset time record, the reset schedule for region people counting will be automatically updated accordingly. |
Step 5: If you want the device to count and report data continuously, skip this step.
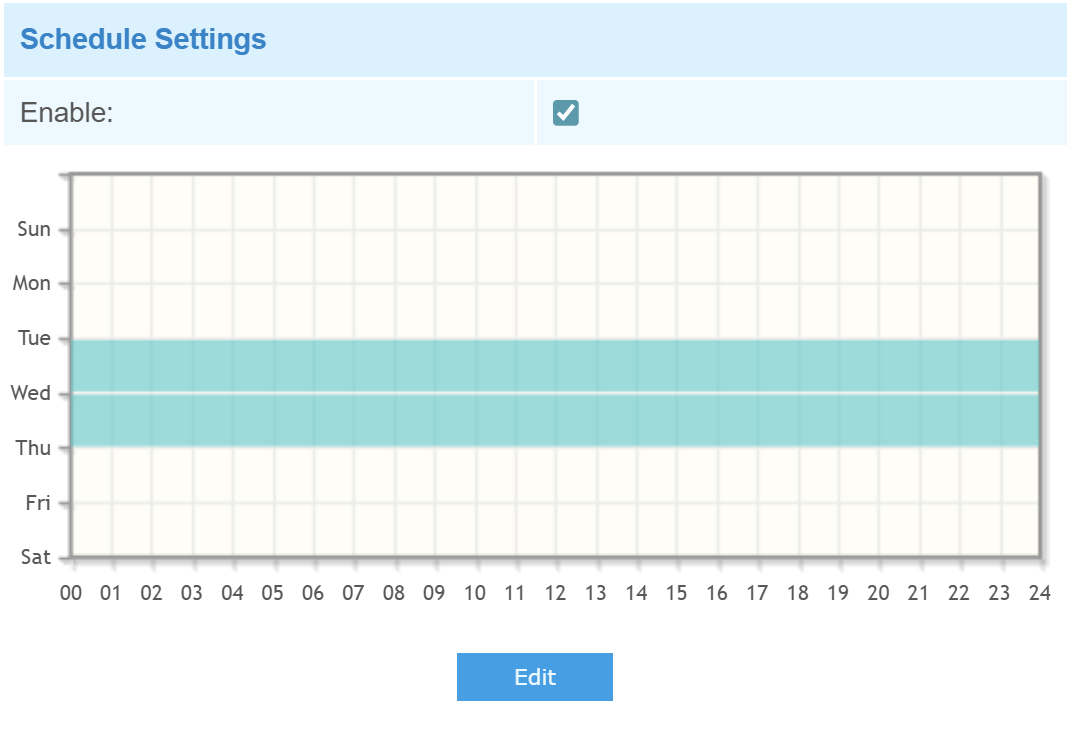
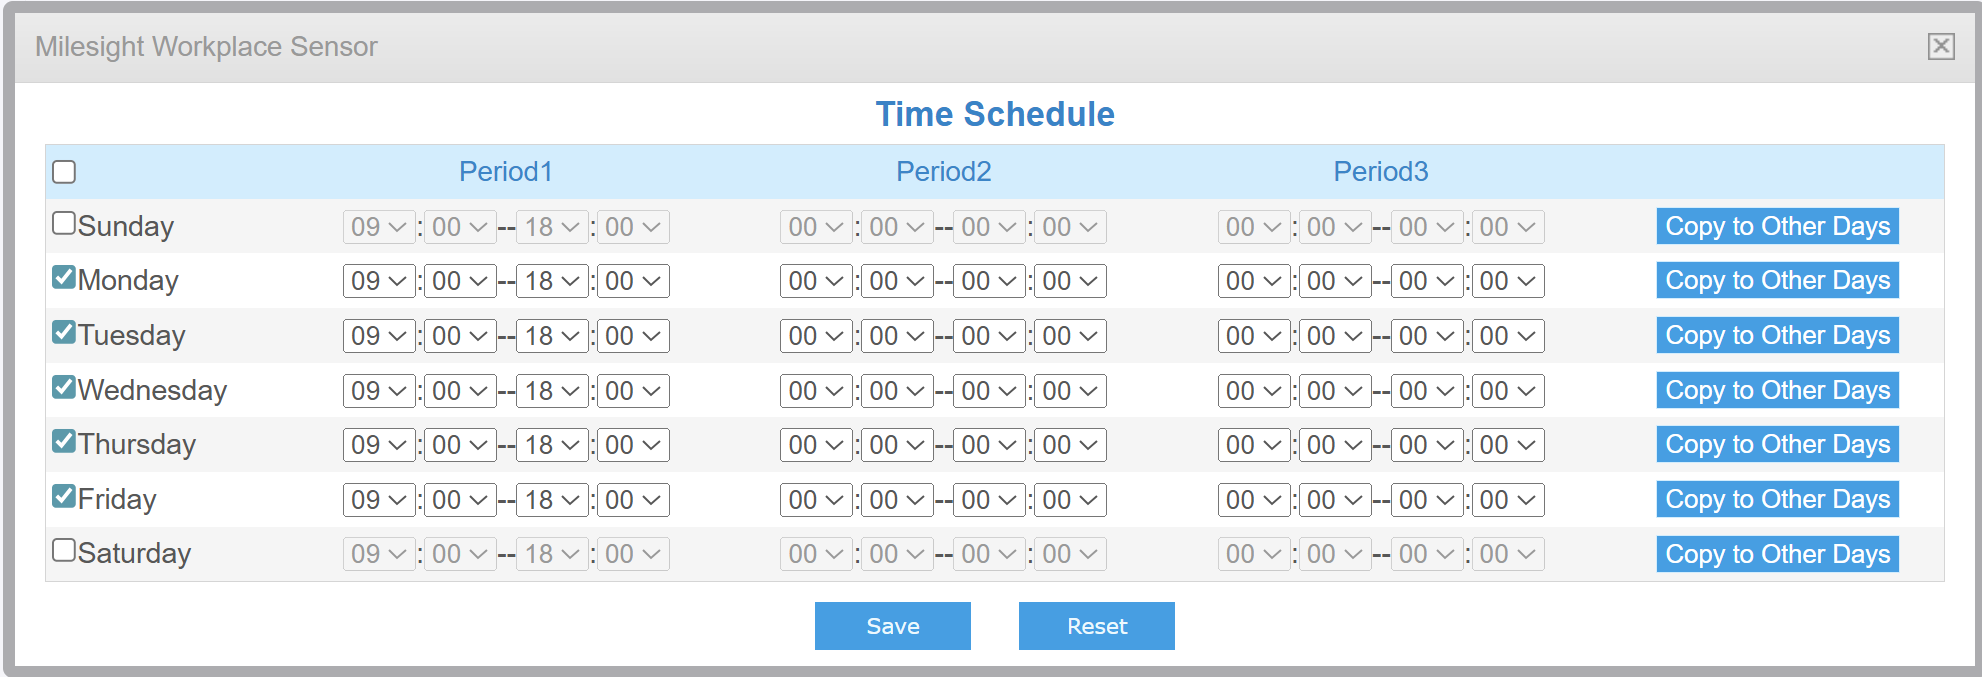
For example, as illustrated in the figure, if you select 9:00 AM to 6:00 PM from Monday to Friday, the device will only upload data within this time window. Data reporting will be disabled during all other periods. By clicking Copy to Other Days button on the right, you can copy all time periods at once, without having to modify each one individually.
Step 6: After completing all the settings, scroll to the bottom and click Save to save all your changes.