Region People Counting
Region People Counting provides automatic, real-time statistics on the number of people within specified regions. With high-precision sensors ensuring seamless data collection, managers can easily track the current occupancy status of each space. It is ideal for conference centers and other venues that require dynamic monitoring of space utilization. Enable this feature if you need to monitor real-time headcount, detect overcrowding, or track personnel movement within certain regions.
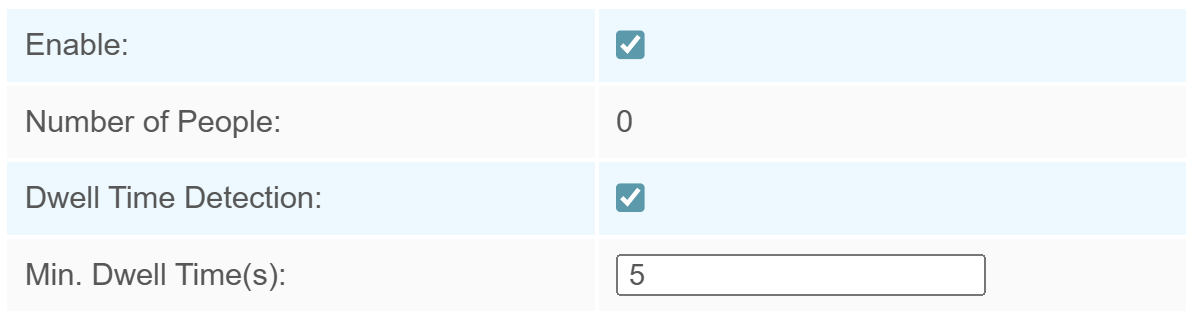
Step 1: Go to People Counting → Region People Counting, to enable region people counting feature, it will show current number of people.
If you want to know dwell time of objects within the area, enable Dwell Time Detection and set Min. Dwell Time. When the object dwells in the area longer than the set Min. Dwell Time, its dwell time will be reported.
Step 2: Draw the detection region. If you want to count the total number of people in the live view, skip this step.
-
-
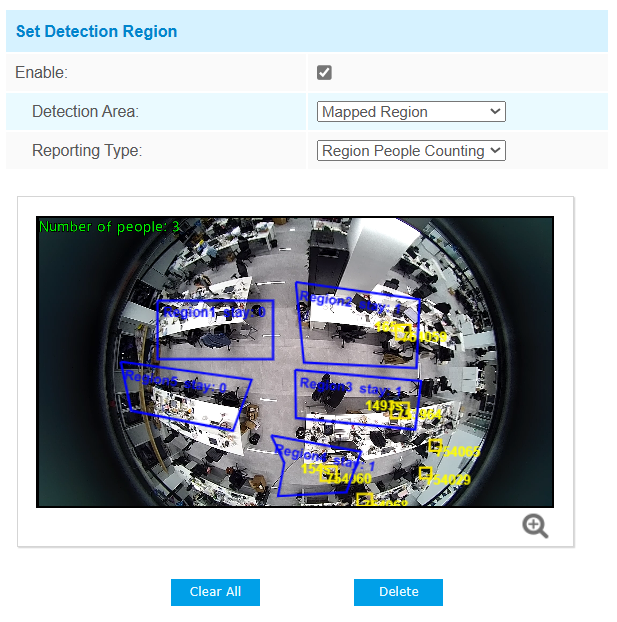
- When you want to distinguish multiple areas within the live view,
enable Set Detection Region, choose Mapped/Non-mapped
Region.
Parameters Description Mapped Region Only people who are in the mapped region will be detected. There are two reporting types:
Occupancy: report the occupancy status of per mapped region.
Region People Counting: report the specific number of people of per mapped region.
Non-mapped Region Only people who are not in the mapped region will be detected. - Move the mouse inside the live view to begin drawing the region,
click
 to zoom in on the display.
 - Left-click to start drawing and drag the mouse to draw a line, left-click again to continue drawing an edge in a different direction, and right-click the mouse to complete the drawing. The point can be dragged to adjust the location and length, up to 16 regions are supported with maximum 10 segments each. You can click on a specific area to Delete it, or click Clear All to remove all regions.
- Click OK to finish drawing.
- When you want to distinguish multiple areas within the live view,
enable Set Detection Region, choose Mapped/Non-mapped
Region.
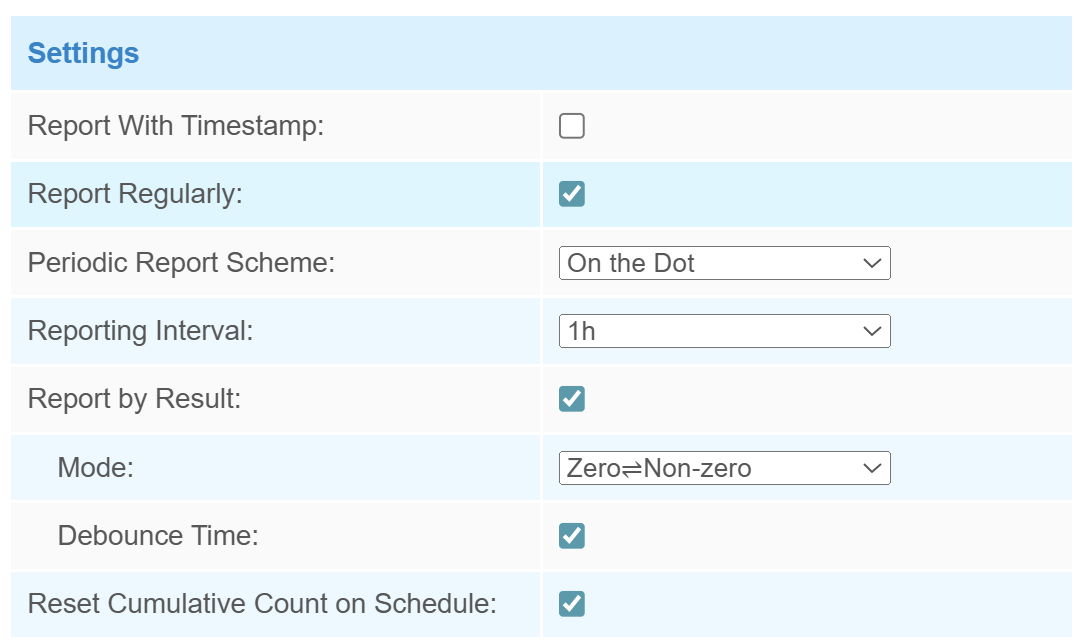
Step 3: Report setting.
| Parameters | Description |
|---|---|
| Report with Timestamp | Enable or disable report the data with timestamp. |
| Report Regularly | Select the periodic report of "On the Dot" or "From Now On". On the Dot: Report at each integer moment. For example, current time is 0:07, when the interval is set to 10 minutes, it will report at 0:10, 0:20, 0:30, and so on. From Now On: Begin reporting from this moment onwards and regularly report based on the interval cycle. |
| Periodic Report Scheme | |
| Reporting Interval | |
| Report by Result | Report according to the following changes of people number result:
|
| Debounce Time | VS121 will reduce the count value only when the people come out of the detection area for more than 2 s. |
| Reset Cumulative Count on Schedule | Enable to periodically reset cumulative count on schedule. Support up
to 5 reset schedules. Cumulative Count includes: Total In/Out counting of each detection region. Max./Avg. Dwell Time of each detection region. Whenever you modify a reset time record, the reset schedule for line crossing counting will be automatically updated accordingly. |
Step 4: If you want the device to count and report data continuously, skip this step.
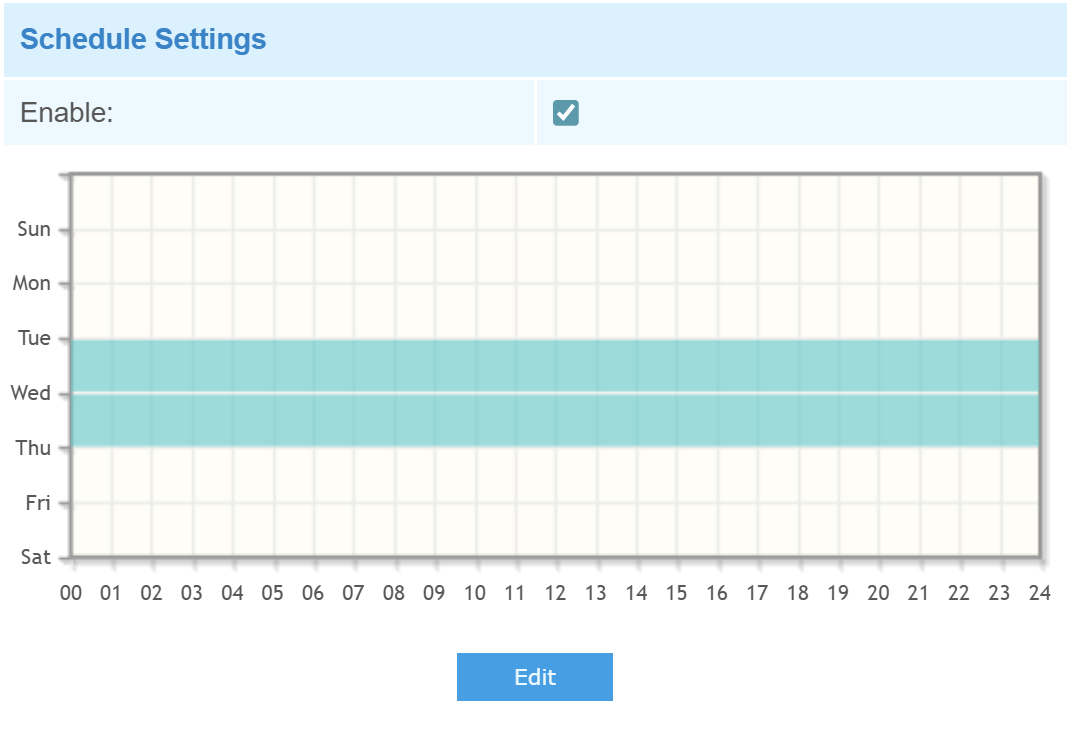
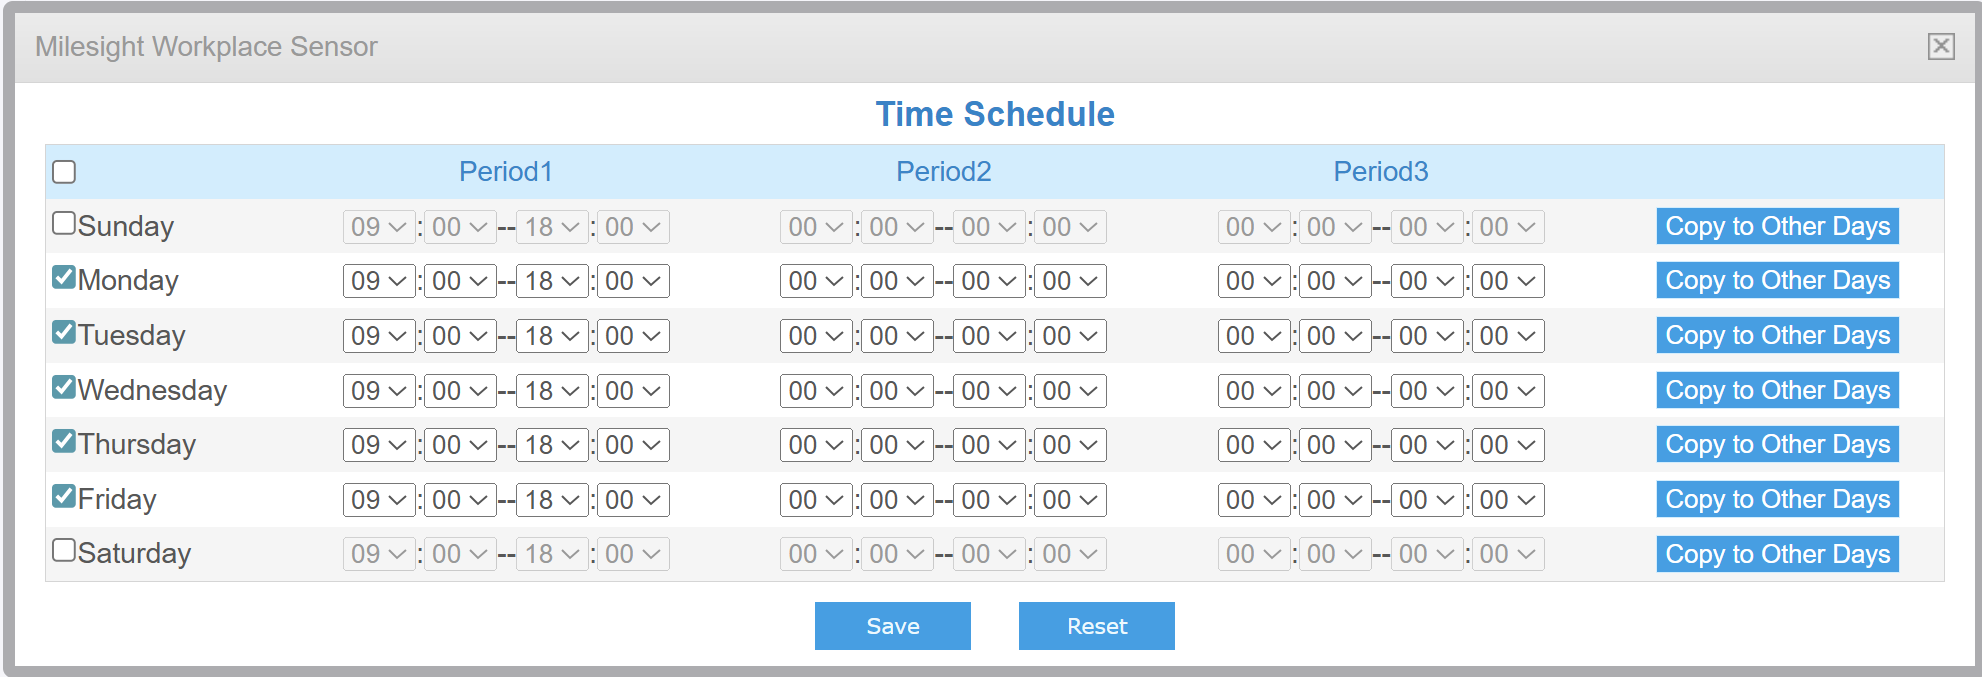
For example, as illustrated in the figure, if you select 9:00 AM to 6:00 PM from Monday to Friday, the device will only upload data within this time window. Data reporting will be disabled during all other periods. By clicking Copy to Other Days button on the right, you can copy all time periods at once, without having to modify each one individually.
Step 5: After completing all the settings, scroll to the bottom and click Save to save all your changes.