Configure Region Monitoring
This section describes how to configure region monitoring.
The device supports region monitoring by tracking person count and dwell time within configured regions for generating valuable analytical data.
Prerequisite:
The deployment parameters and device strategies are configured.
Steps:
- In the main page, click Rule from the left navigation tree.
-
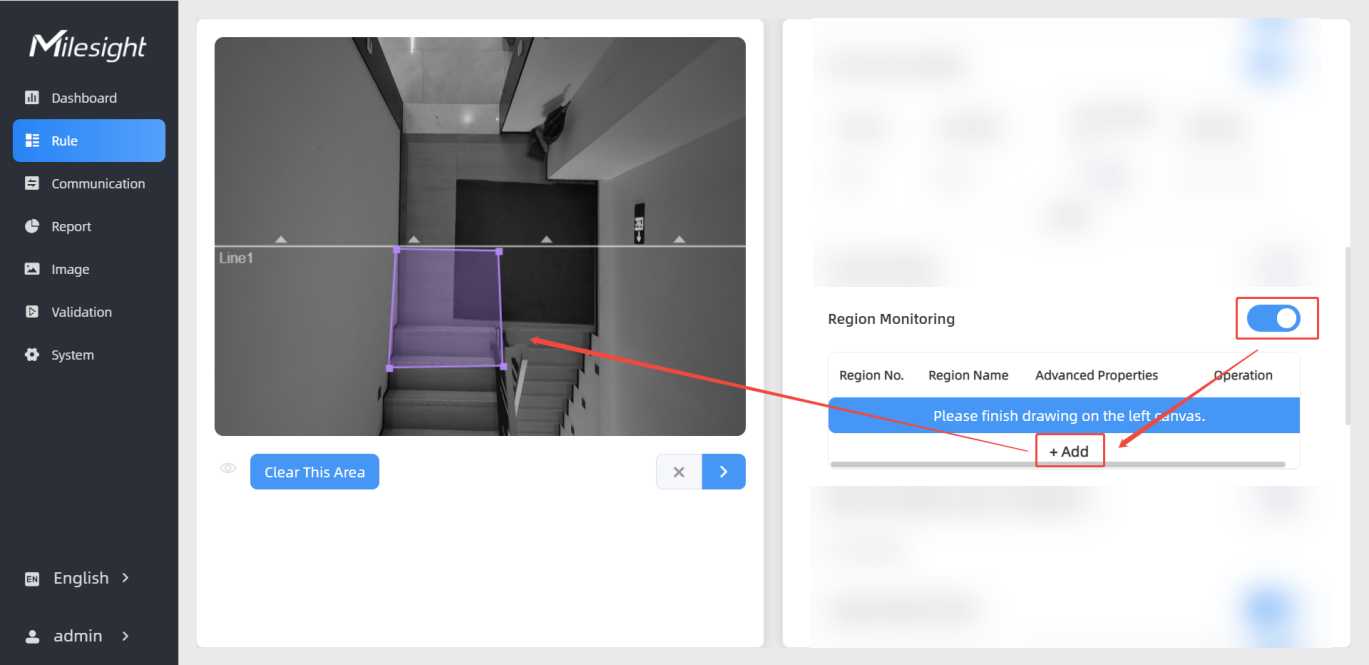
Enable Region Monitoring on the right and click +Add.
-
Draw a region for monitoring in the live view, you can draw up to 4 regions with a maximum of 10 points per region:
- Left-click to start and drag to draw the first line segment.
- Left-click to add vertices and change direction and drag to draw another line segment.
- Repeat step b to draw more line segments as needed.
- Right-click to finish.
- (Optional) Adjust the region by dragging.
- (Optional) To redraw a region, click Clear This Area.
- Click
 .
The Advanced Properties dialog box is displayed. Configure advanced properties parameters.
.
The Advanced Properties dialog box is displayed. Configure advanced properties parameters.
- In the Zone name area, customize the region name.
- Enable at least one advanced property. Options:
Region People Counting, Single Dwell Time Detection
Continuous Dwell Time Detection.
Table 1. Single Dwell Time Detection Continuous Dwell Time Detection How It Works Dwell time resets each time the same target leaves and re-enters the area. Dwell time is accumulated across multiple entries of the same target until it disappears. Use Cases Queue management: individual wait-time analysis Engagement analysis: window display attraction and counter engagement -
Perform the following operations as needed.
If Do If Region People Counting is enabled In the Pass-by Filtering text box, enter a value as needed. If Single Dwell Time Detection is enabled In the Min. Dwell Time text box, enter a value as needed. If Continuous Dwell Time Detection is enabled In the Min. Dwell Time text box, enter a value as needed. - Click
 to save the configuration.
- The region information is displayed in the list on the right.
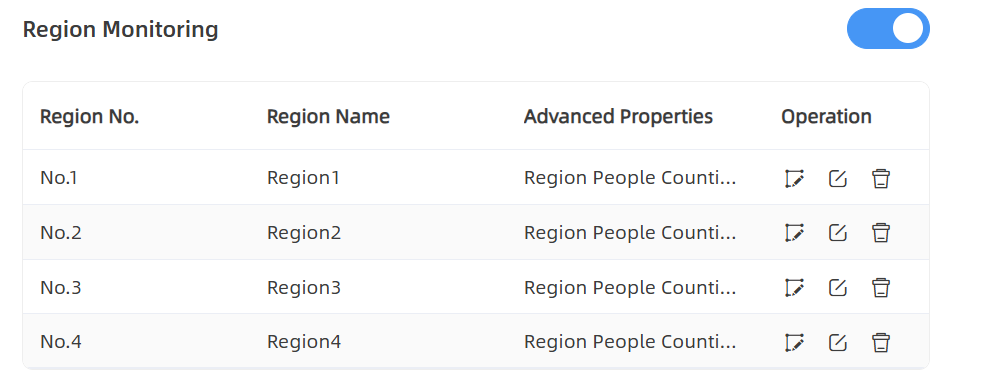
- (Optional) Perform the following operations as needed.
- To redraw the region, click
 .
. - To modify the advanced properties of the region, click
 .
. - To delete the region, click
 .
.
- To redraw the region, click
-
Check data through any of the following methods:
-
To check the visual configuration effect, click Dashboard from the left navigation tree.

- To view the region data for a certain time period
and generate the corresponding report, click Report from the left navigation tree. For details, refer to Generate
Reports.

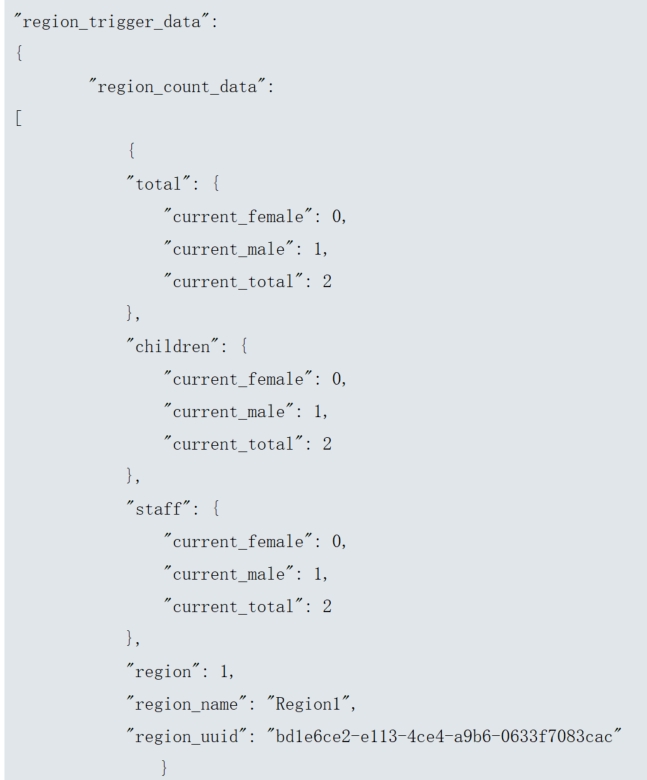
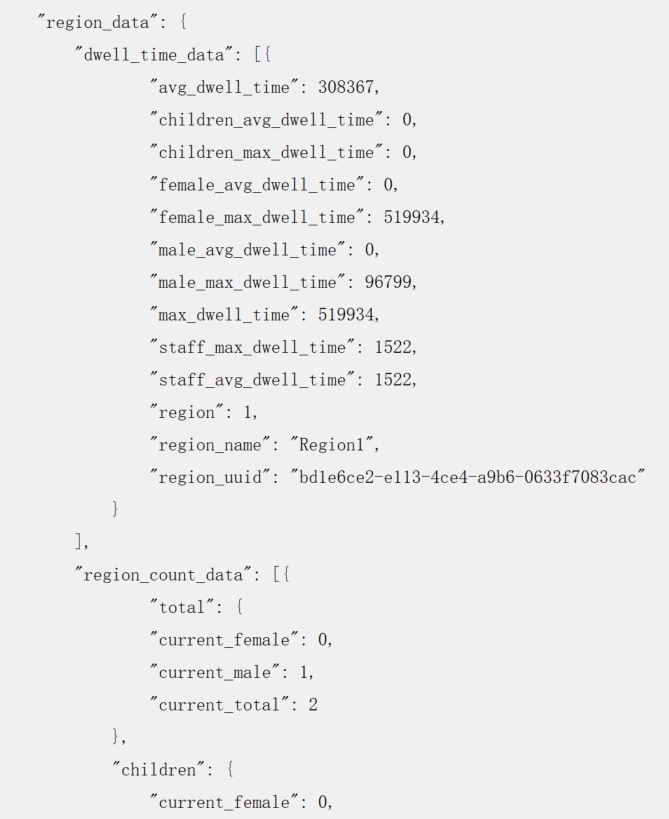
- If recipients are added, check data through
command line outputs. For "region_data", refer to Uplink Data
Example for Periodic Reporting. For "region_trigger_data",
refer to Uplink Data Examples for Trigger Reporting.
-