Report
The device supports visual line chart or bar chart generation to display people traffic and supports report exporting. Before using this feature, do ensure that the device time is correct on System page.

| Parameters | Description |
|---|---|
| Data Type | Select the data type which you want to query the report, the relevant events will be displayed accordingly. |
| Event | |
| Time Unit | Select the unit to generate the graph or export the data. |
| Time Range | Select the time range to generate the graph. |
 |
Click to generate or refresh the graph according to the previously selected option. |
 |
Select whether to include staff counting values on the graph. |
 |
Select the display type as line or bar. |
| Click to download the chart screenshot. | |
| Export the historical traffic data as CSV file according to the selected option. The device can store up to one million data records to CSV file. | |
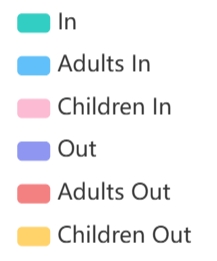 |
The chart displays multiple data types. Click on any category will hide it from the chart. |