People Flow Analysis
People Flow Analysis uses custom polygonal zones to track and visualize real-time movement between different boundaries. The system records how people enter and exit through various sides, showing clear patterns of flow within the area. This is ideal for public spaces and other settings where in-depth analysis of movement paths and flow directions is needed.
Step 1: Go to People Counting → People Flow Analysis, to enable people flow analysis feature.
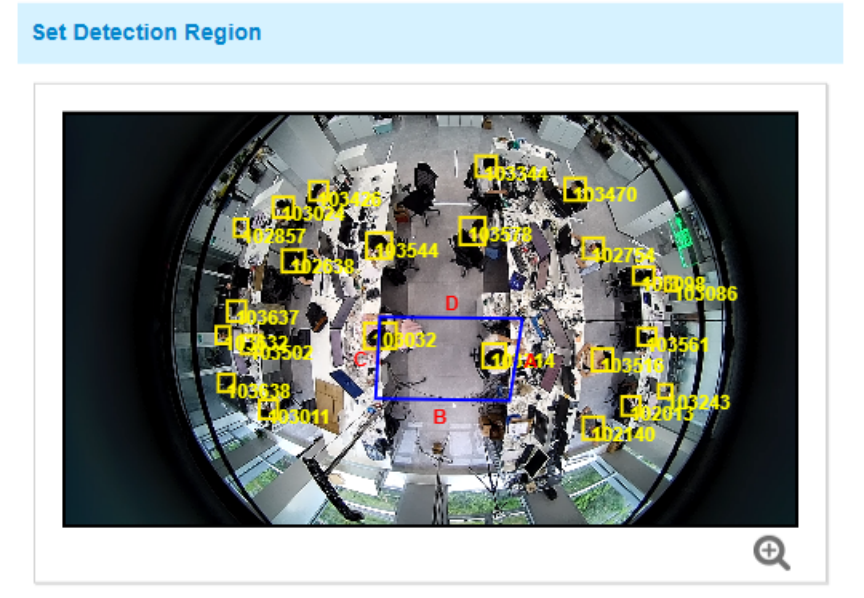
Step 2: Move the mouse inside the live view to begin drawing the region, click
![]() to zoom in on the display. Customize a triangle
or a convex quadrangle to count the flow of people moving from one edge to another, such
as from B to D.
to zoom in on the display. Customize a triangle
or a convex quadrangle to count the flow of people moving from one edge to another, such
as from B to D.
Step 3: Report setting.
| Parameters | Description |
|---|---|
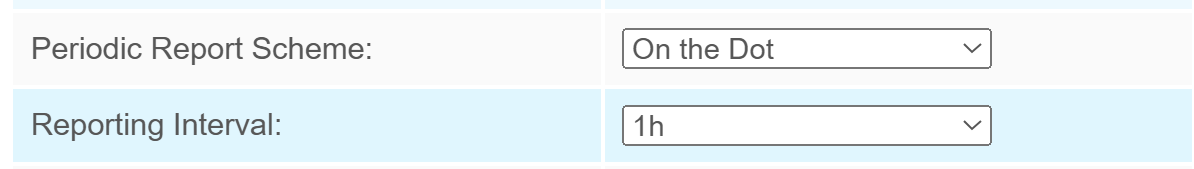
| Periodic Report Scheme | Select the periodic report
of "On the Dot" or "From Now On". On the Dot: Report at each integer moment. For example, current time is 0:07, when the interval is set to 10 minutes, it will report at 0:10, 0:20, 0:30, and so on. From Now On: Begin reporting from this moment onwards and regularly report based on the interval cycle. |
| Reporting Interval |
Step 4: Protocol Integration Setting.
| Parameters | Description |
|---|---|
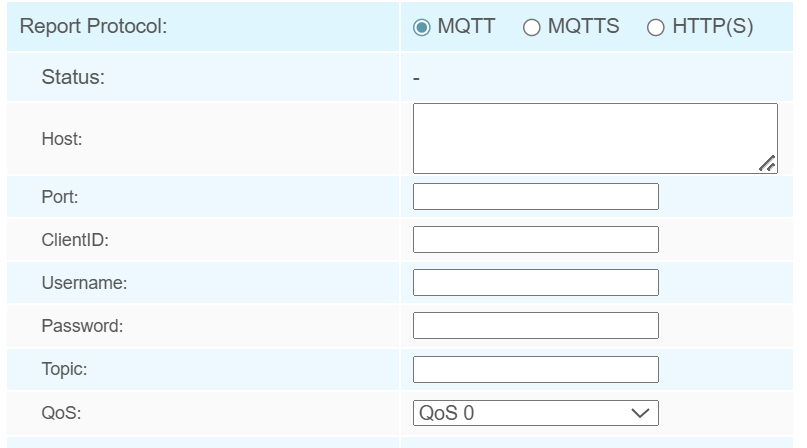
| MQTT/MQTTS | |
| Host | MQTT broker address for receiving data. |
| Port | MQTT broker port for receiving data. |
| Client ID | The unique identity of the client to
the server. It must be unique when all clients are connected to the same server, and it is the key to handle messages at QoS 1 and 2. |
| Username | The username used for connecting to the MQTT broker. |
| Password | The password used for connecting to the MQTT broker. |
| Topic | Topic name used for publishing. |
| QoS | QoS0, QoS1, and QoS2 are optional. |
| HTTP(S) | |
| HTTP Notification URL | Select among “URL 1”, “URL 2” and “URL 3”. |
| Enable | Enable to configure this URL. |
| Connection Test | Click to send test message to URL to check connectivity. |
| HTTP Method | Fixed as Post. |
| Snapshot | Enable or disable the snapshot feature.
Note: the option is only available for normal
privacy mode. |
| URL | The device will post the people counting data in json format to this URL. |
| User Name | The username used for authentication. |
| Password | The password used for authentication. |
Step 5: If you want the device to count and report data continuously, skip this step.
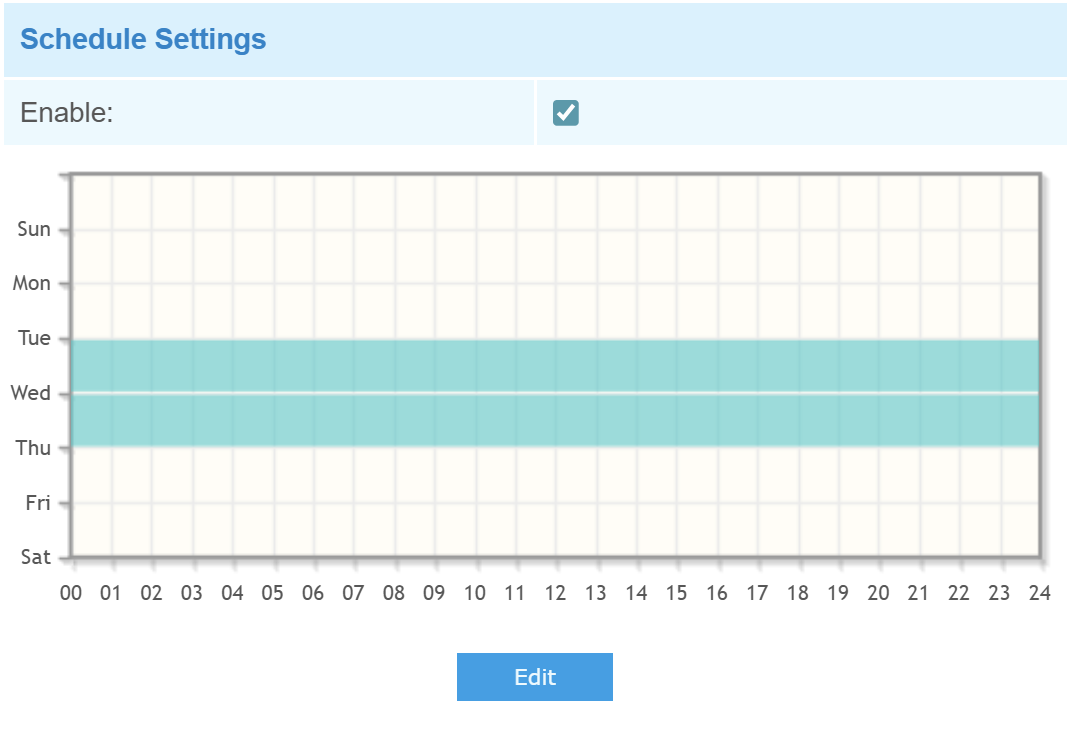
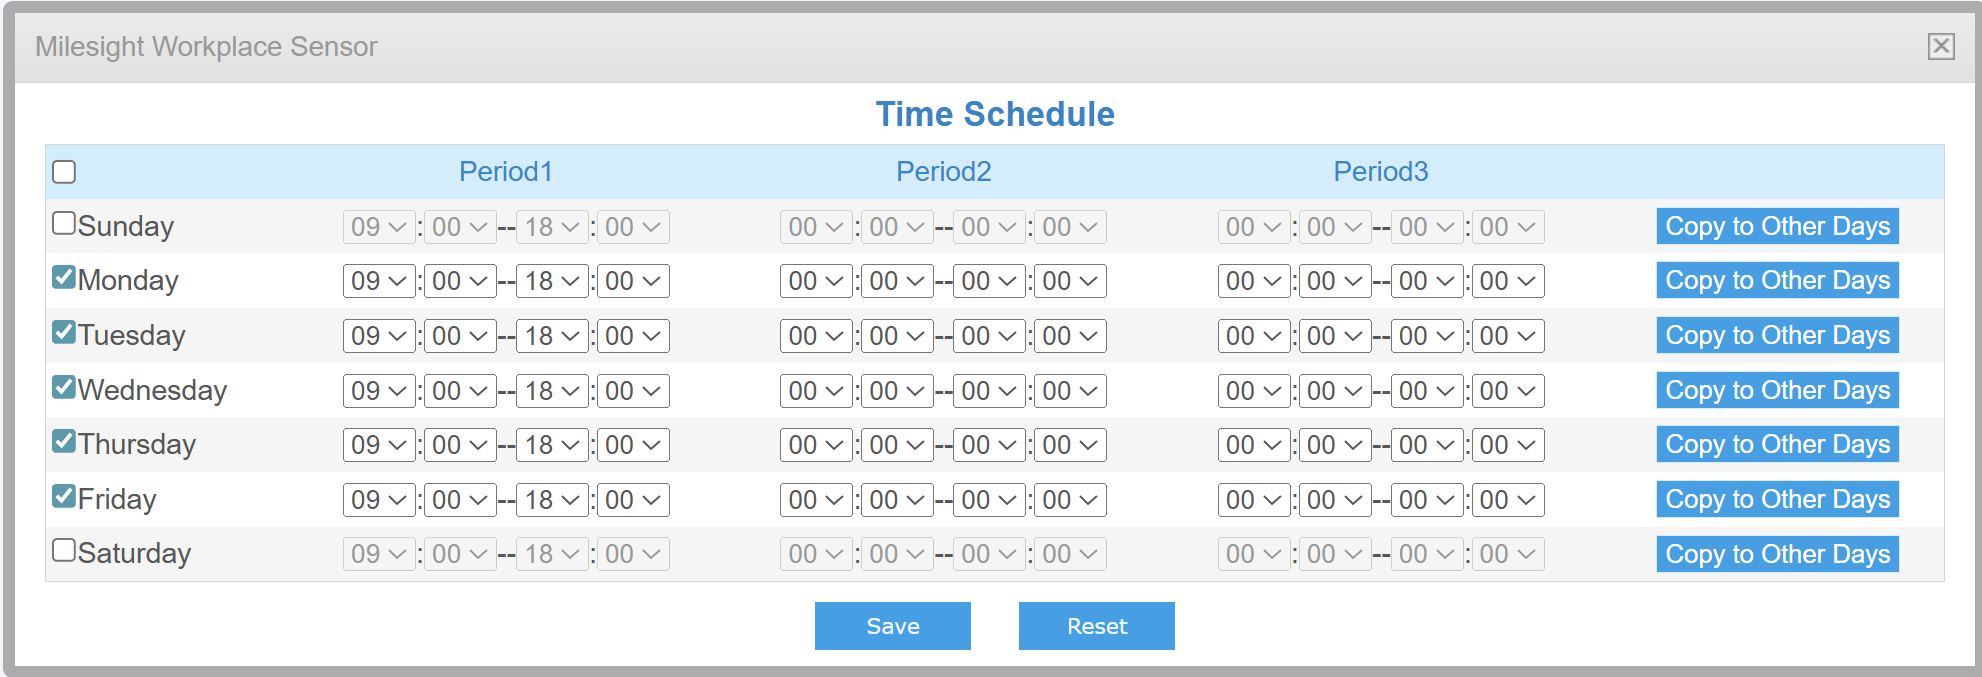
For example, as illustrated in the figure, if you select 9:00 AM to 6:00 PM from Monday to Friday, the device will only upload data within this time window. Data reporting will be disabled during all other periods. By clicking Copy to Other Days button on the right, you can copy all time periods at once, without having to modify each one individually.
Step 6: After completing all the settings, scroll to the bottom and click Save to save all your changes.
Step 7: You can view the data through periodic report.