Region People Counting
Region People Counting provides automatic, real-time statistics on the number of people within specified regions. With high-precision sensors ensuring seamless data collection, managers can easily track the current occupancy status of each space. It is ideal for conference centers and other venues that require dynamic monitoring of space utilization. Enable this feature if you need to monitor real-time headcount, detect overcrowding, or track personnel movement within certain regions.
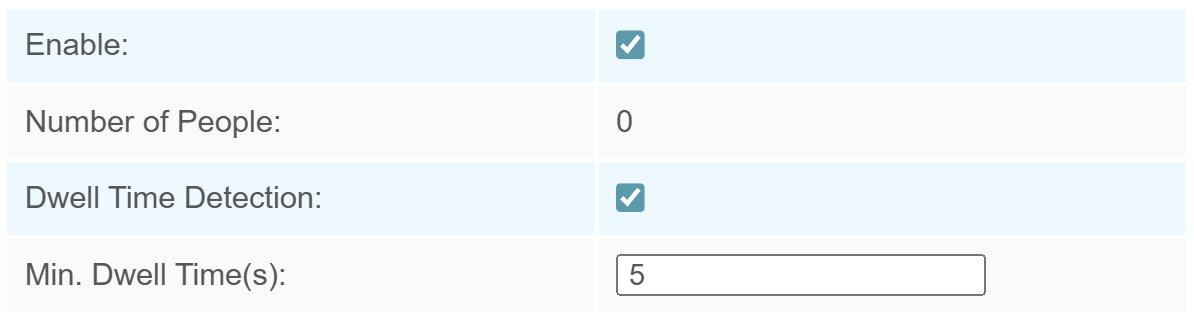
Step 1: Go to People Counting → Region People Counting, to enable region people counting feature, it will show current number of people.
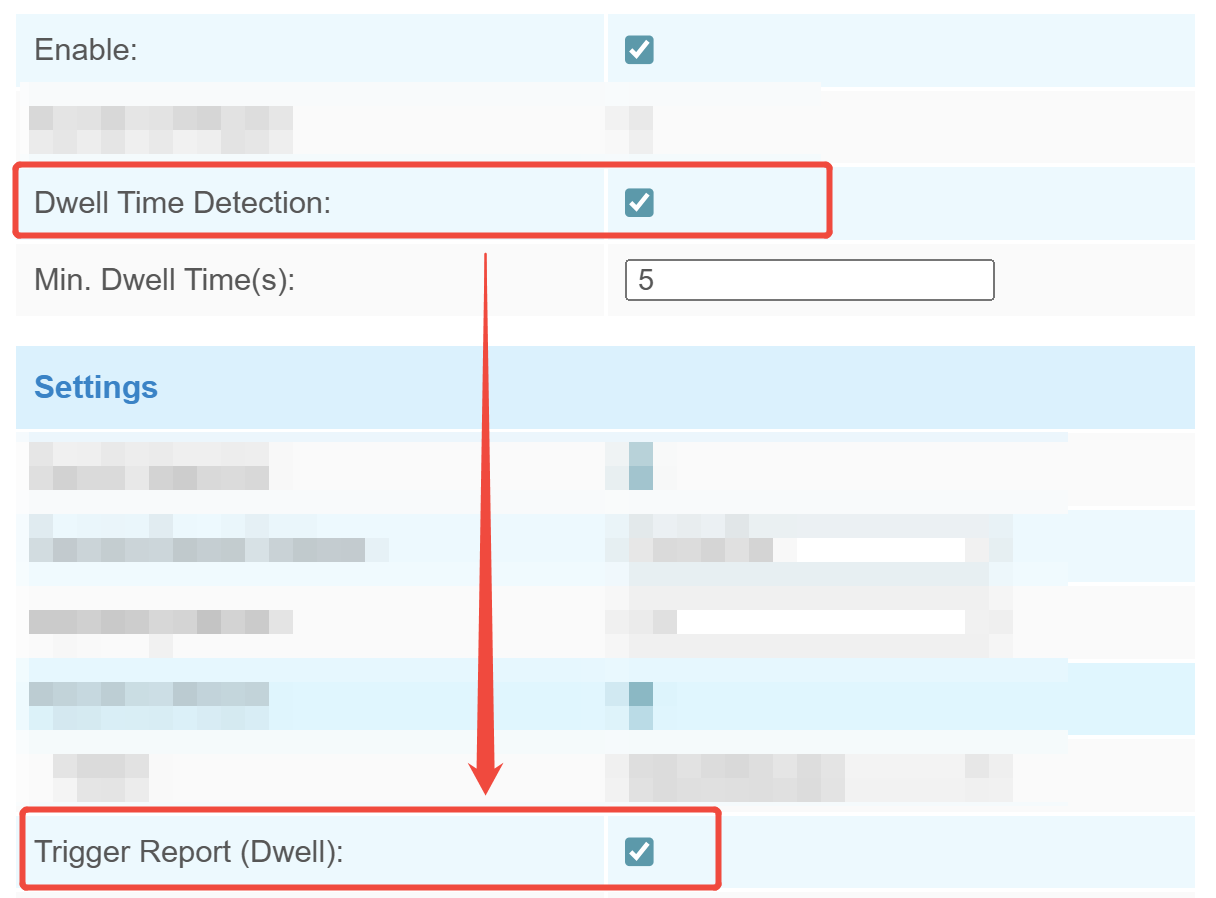
If you want to know dwell time of objects within the area, enable Dwell Time Detection and set Min. Dwell Time. When the object dwells in the area longer than the set Min. Dwell Time, its dwell time will be reported.
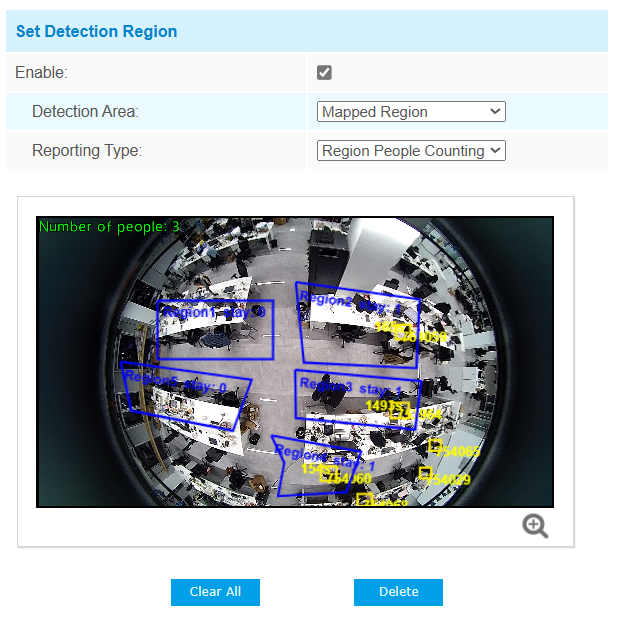
Step 2: Draw the detection region. If you want to count the total number of people in the live view, skip this step.
-
-
- When you want to distinguish multiple areas within the live view,
enable Set Detection Region, choose Mapped/Non-mapped
Region.
Parameters Description Mapped Region Only people who are in the mapped region will be detected. There are two reporting types:
Occupancy: report the occupancy status of per mapped region.
Region People Counting: report the specific number of people of per mapped region.
Non-mapped Region Only people who are not in the mapped region will be detected. - Move the mouse inside the live view to begin drawing the region,
click
 to zoom in on the display.
 - Left-click to start drawing and drag the mouse to draw a line, left-click again to continue drawing an edge in a different direction, and right-click the mouse to complete the drawing. Then customize the region name. The point can be dragged to adjust the location and length, up to 16 regions are supported with maximum 10 segments each. You can click on a specific area to Delete it, or click Clear All to remove all regions.
- Click OK to finish drawing.
- When you want to distinguish multiple areas within the live view,
enable Set Detection Region, choose Mapped/Non-mapped
Region.
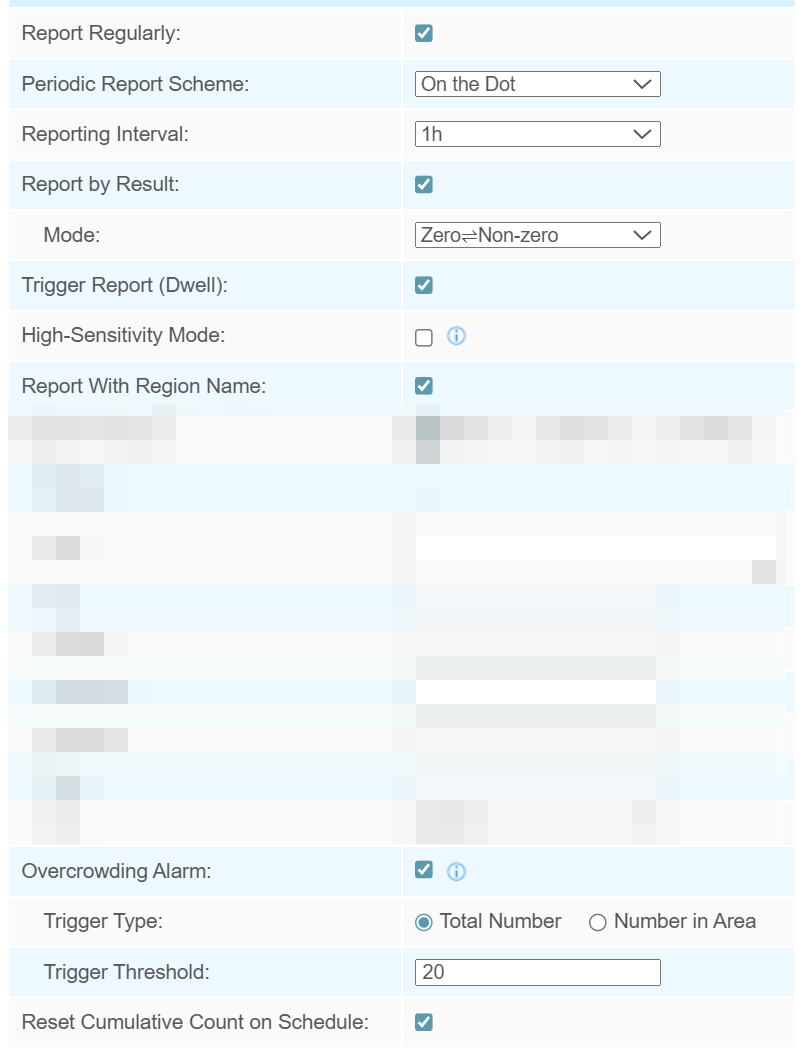
Step 3: Report setting.
| Parameters | Description |
|---|---|
| Report with Timestamp | Enable or disable report the data with timestamp. |
| Report Regularly | Select the periodic report of "On the Dot" or "From Now On". On the Dot: Report at each integer moment. For example, current time is 0:07, when the interval is set to 10 minutes, it will report at 0:10, 0:20, 0:30, and so on. From Now On: Begin reporting from this moment onwards and regularly report based on the interval cycle. |
| Periodic Report Scheme | |
| Reporting Interval | |
| Report by Result | Report according to the following changes of people number result:
|
| High-Sensitivity Mode | When enabled, the speed of trigger report will increase. Note: Trigger report speed will increase when
High-Sensitivity Mode enabled,but the frequency of counting results
changing will also rise. |
| Report With Region Name | Enable the reporting of custom region names. |
| Overcrowding Alarm | When the number of people is over the trigger threshold, the DO and COM will be breaked, when the number is within the threshold, DO and COM be spliced. |
| Trigger Type | Select the trigger type. If there is not
area, the trigger type is total people number of live view. Total number: total people number of all drawn areas. Number in area: the number of people in any one area. |
| Trigger Threshold | The threshold people number to trigger the DO. |
| Reset Cumulative Count on Schedule | Enable to periodically reset cumulative count on schedule. Support up
to 5 reset schedules. Cumulative Count includes: Total In/Out counting of each detection region. Max./Avg. Dwell Time of each detection region. Whenever you modify a reset time record, the reset schedule for line crossing counting will be automatically updated accordingly. |
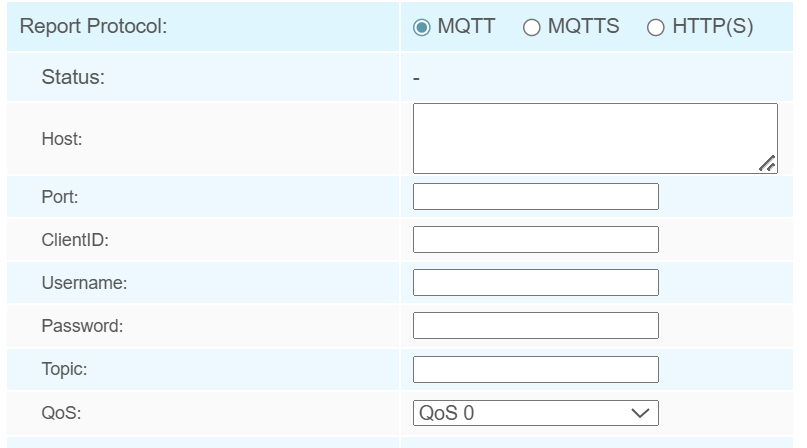
Step 4: Protocol Integration Setting.
| Parameters | Description |
|---|---|
| MQTT/MQTTS | |
| Host | MQTT broker address for receiving data. |
| Port | MQTT broker port for receiving data. |
| Client ID | The unique identity of the client to
the server. It must be unique when all clients are connected to the same server, and it is the key to handle messages at QoS 1 and 2. |
| Username | The username used for connecting to the MQTT broker. |
| Password | The password used for connecting to the MQTT broker. |
| Topic | Topic name used for publishing. |
| QoS | QoS0, QoS1, and QoS2 are optional. |
| HTTP(S) | |
| HTTP Notification URL | Select among “URL 1”, “URL 2” and “URL 3”. |
| Enable | Enable to configure this URL. |
| Connection Test | Click to send test message to URL to check connectivity. |
| HTTP Method | Fixed as Post. |
| Snapshot | Enable or disable the snapshot feature.
Note: the option is only available for normal
privacy mode. |
| URL | The device will post the people counting data in json format to this URL. |
| User Name | The username used for authentication. |
| Password | The password used for authentication. |
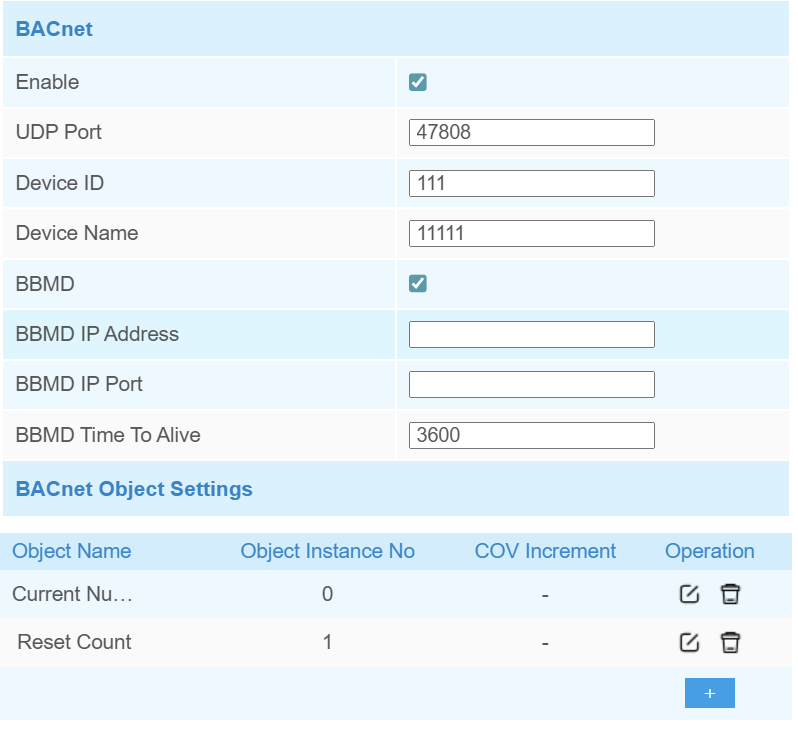
Step 5: BACnet Setting. If you don't need to connect to the BMS system using the BACnet protocol, skip this step.
| Parameters | Description |
|---|---|
| UDP Port | Set communication port of BACnet/IP. Range: 1-65535. The default port is 47808. |
| Device ID | The unique BACnet device identifier that must avoid conflicts with other devices. The default value is the 6th to 11th characters of SN. |
| Device Name | The name to represent the device. |
| BBMD | Enable BBMD(BACnet/IP Broadcast
Management Device) if BACnet devices of different network subnets should
work together.
|
BACnet
Object Settings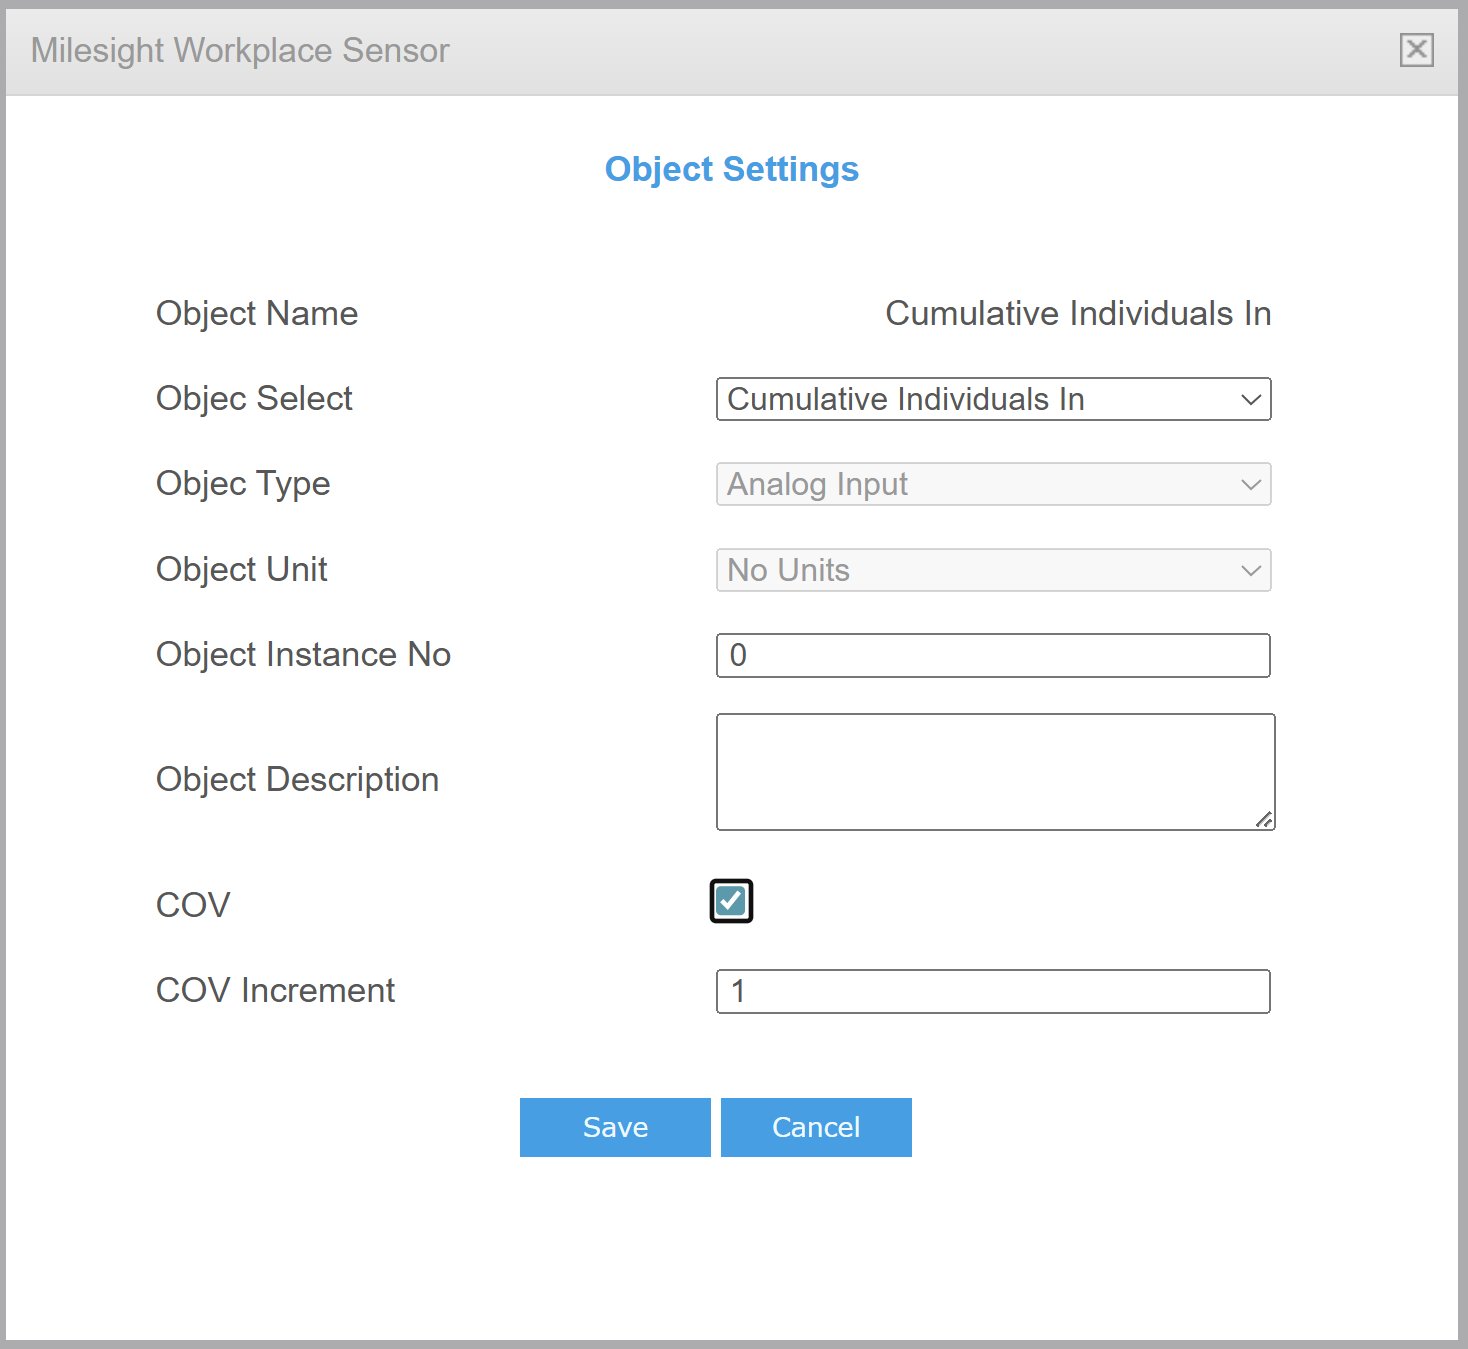 |
|
| Object Name | Show the name of the BACnet object. |
| Object Select | Select the variable data for the device as an object. |
| Region | Select one of the detection region which object you select. |
| Object Instance No. | Set the unique object instance number. |
| Object Description | Set the object description. |
| COV | Enable, when object value changes, it will send notification of new value to BACnet client. |
| COV Increment | Set the minimum change value for the current object. |
Step 6: If you want the device to count and report data continuously, skip this step.
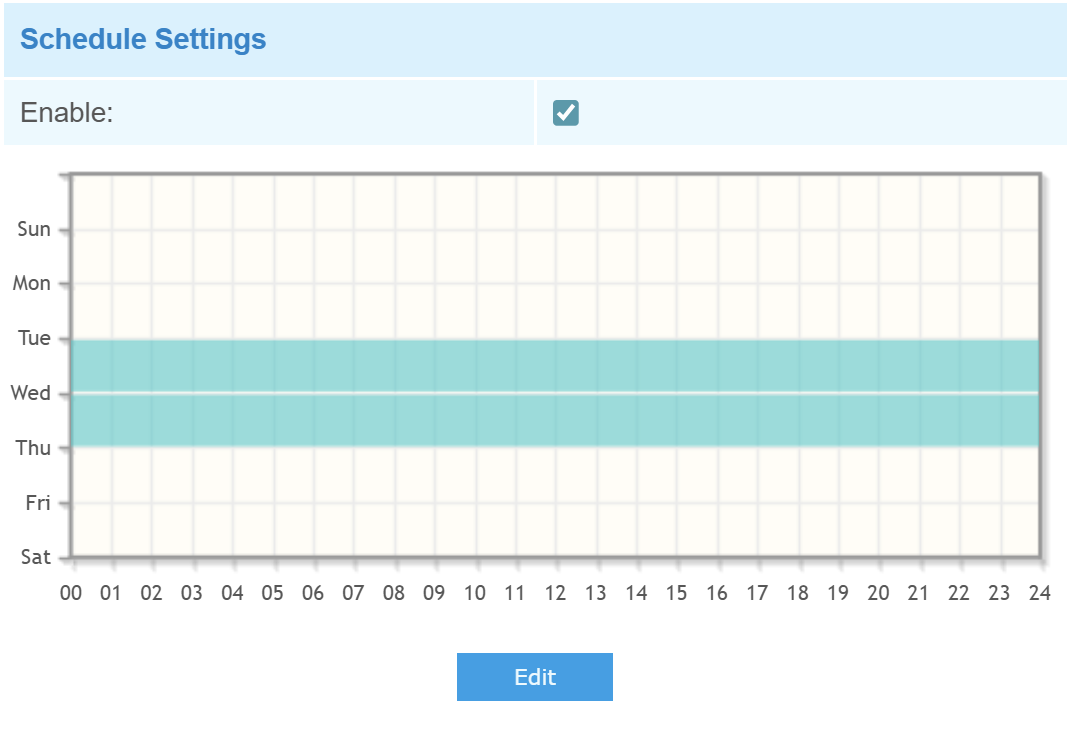
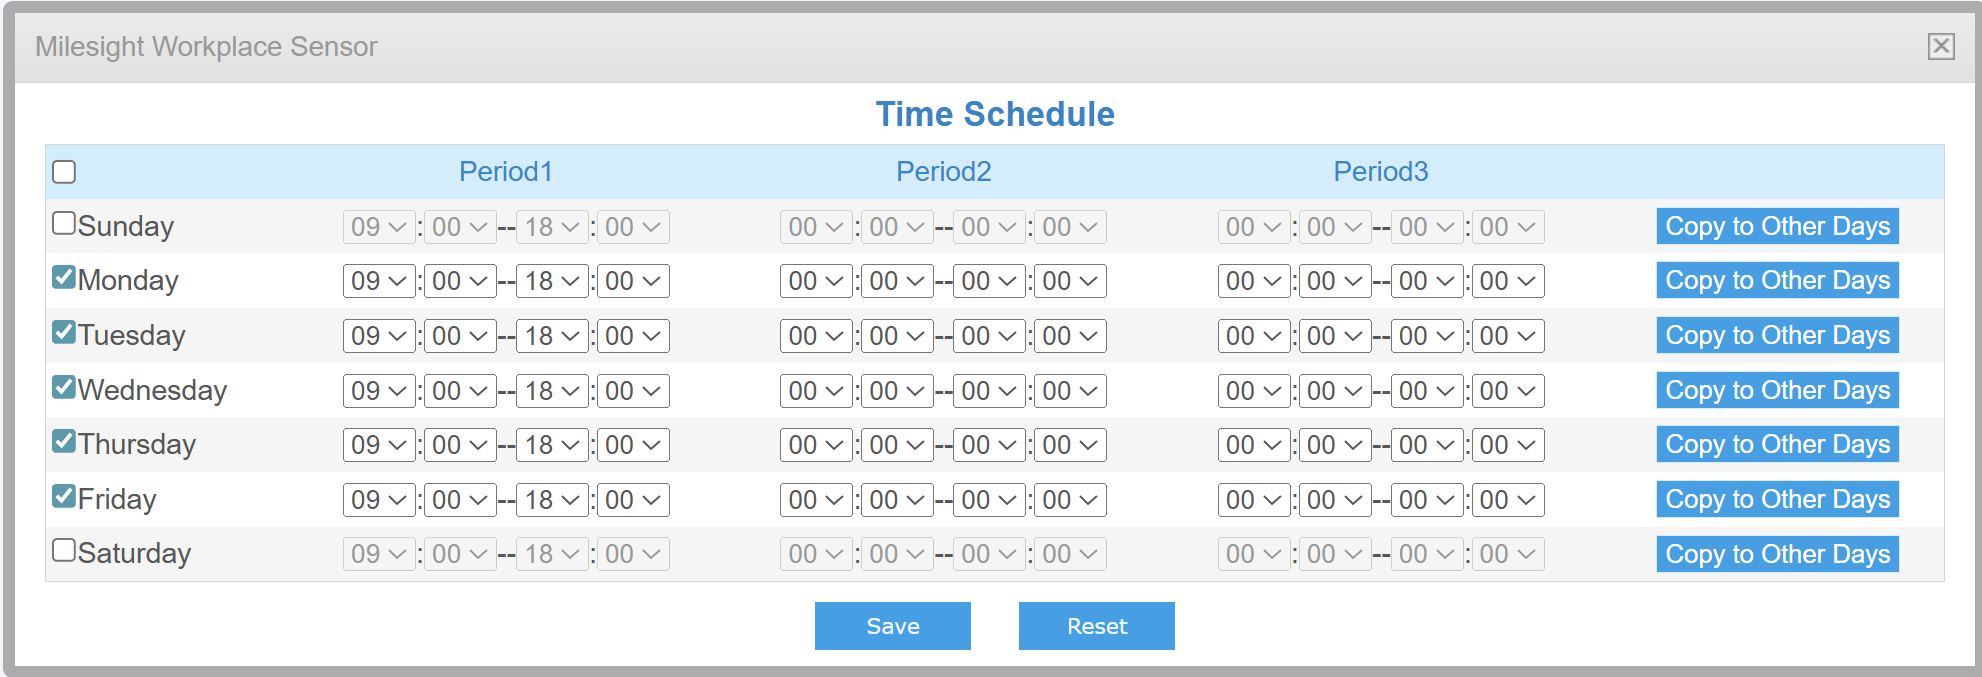
For example, as illustrated in the figure, if you select 9:00 AM to 6:00 PM from Monday to Friday, the device will only upload data within this time window. Data reporting will be disabled during all other periods. By clicking Copy to Other Days button on the right, you can copy all time periods at once, without having to modify each one individually.
Step 7: After completing all the settings, scroll to the bottom and click Save to save all your changes.
Step 8: You can view the data through periodic report and trigger report.