View Direction Detection
The device is able to effectively evaluate the actual reach of the advertisement by tracking the target's view track.
Rather than directly tracking the specific line of sight of the eyeballs, the device recognizes the direction of vision by detecting the orientation of the target's head. Therefore, if the target rotates eyes but keeps head still, the device may not accurately sense the change in line of sight.
- The operating installation height of this function is 2.2 ~ 4m.
- This feature is Not Supported when tracking mode is Feet Tracking.
- This feature is only available in Standalone mode because the presentation of vision direction may differ when multiple devices are stitched.
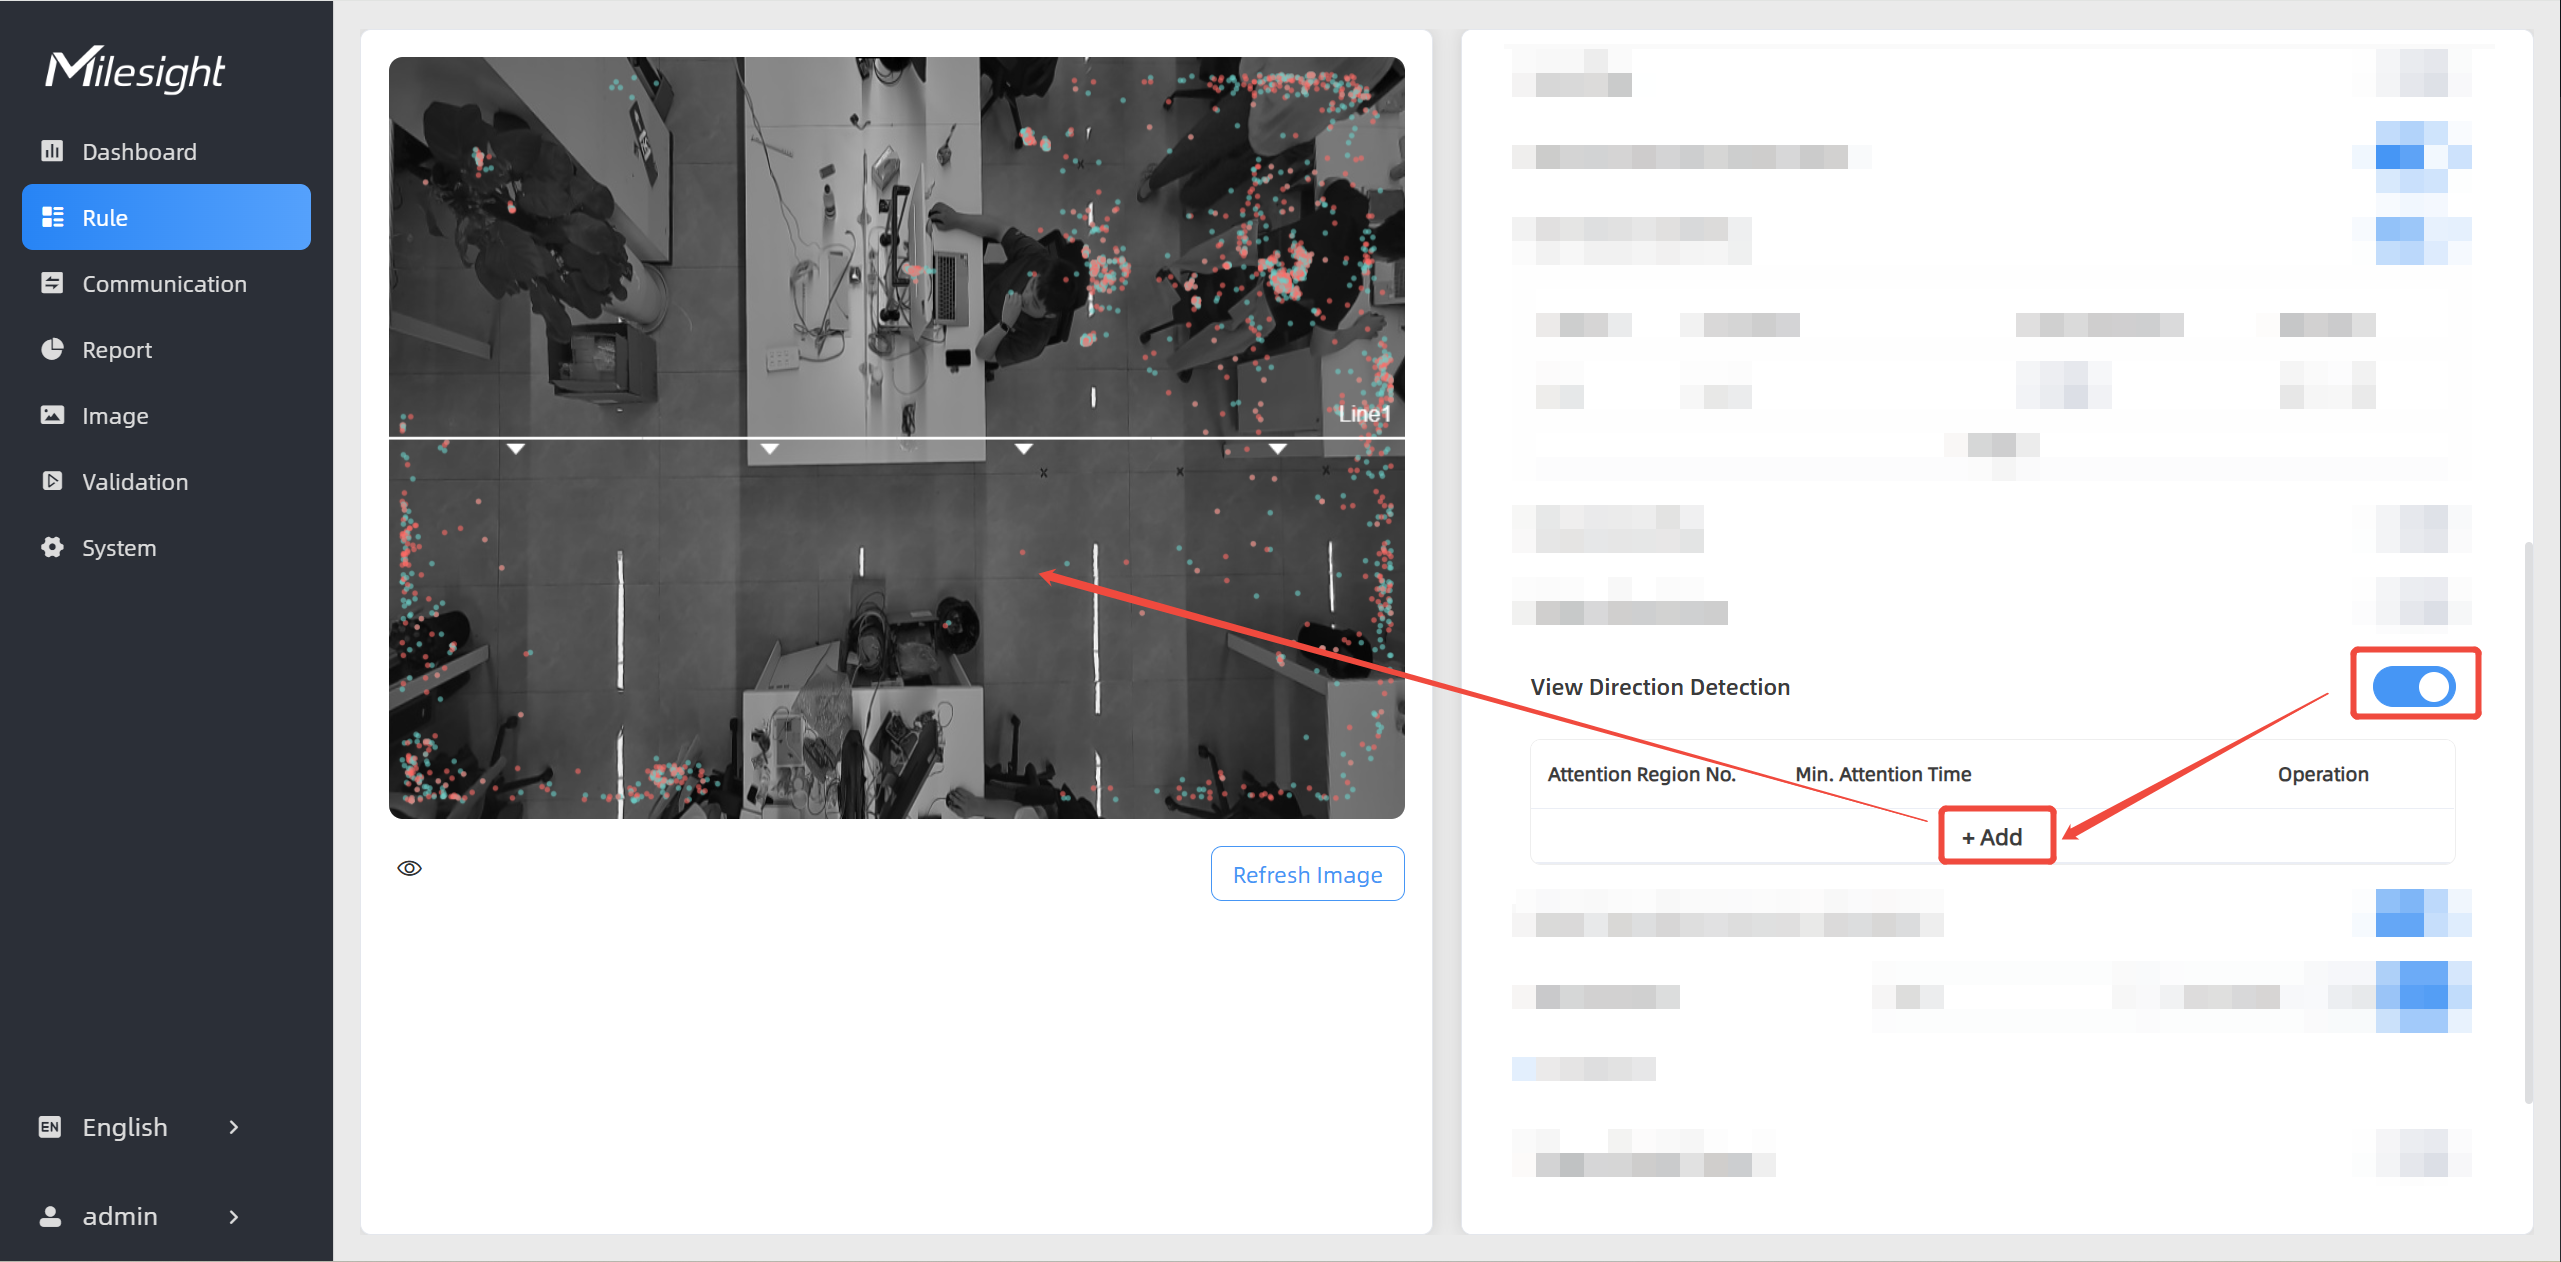
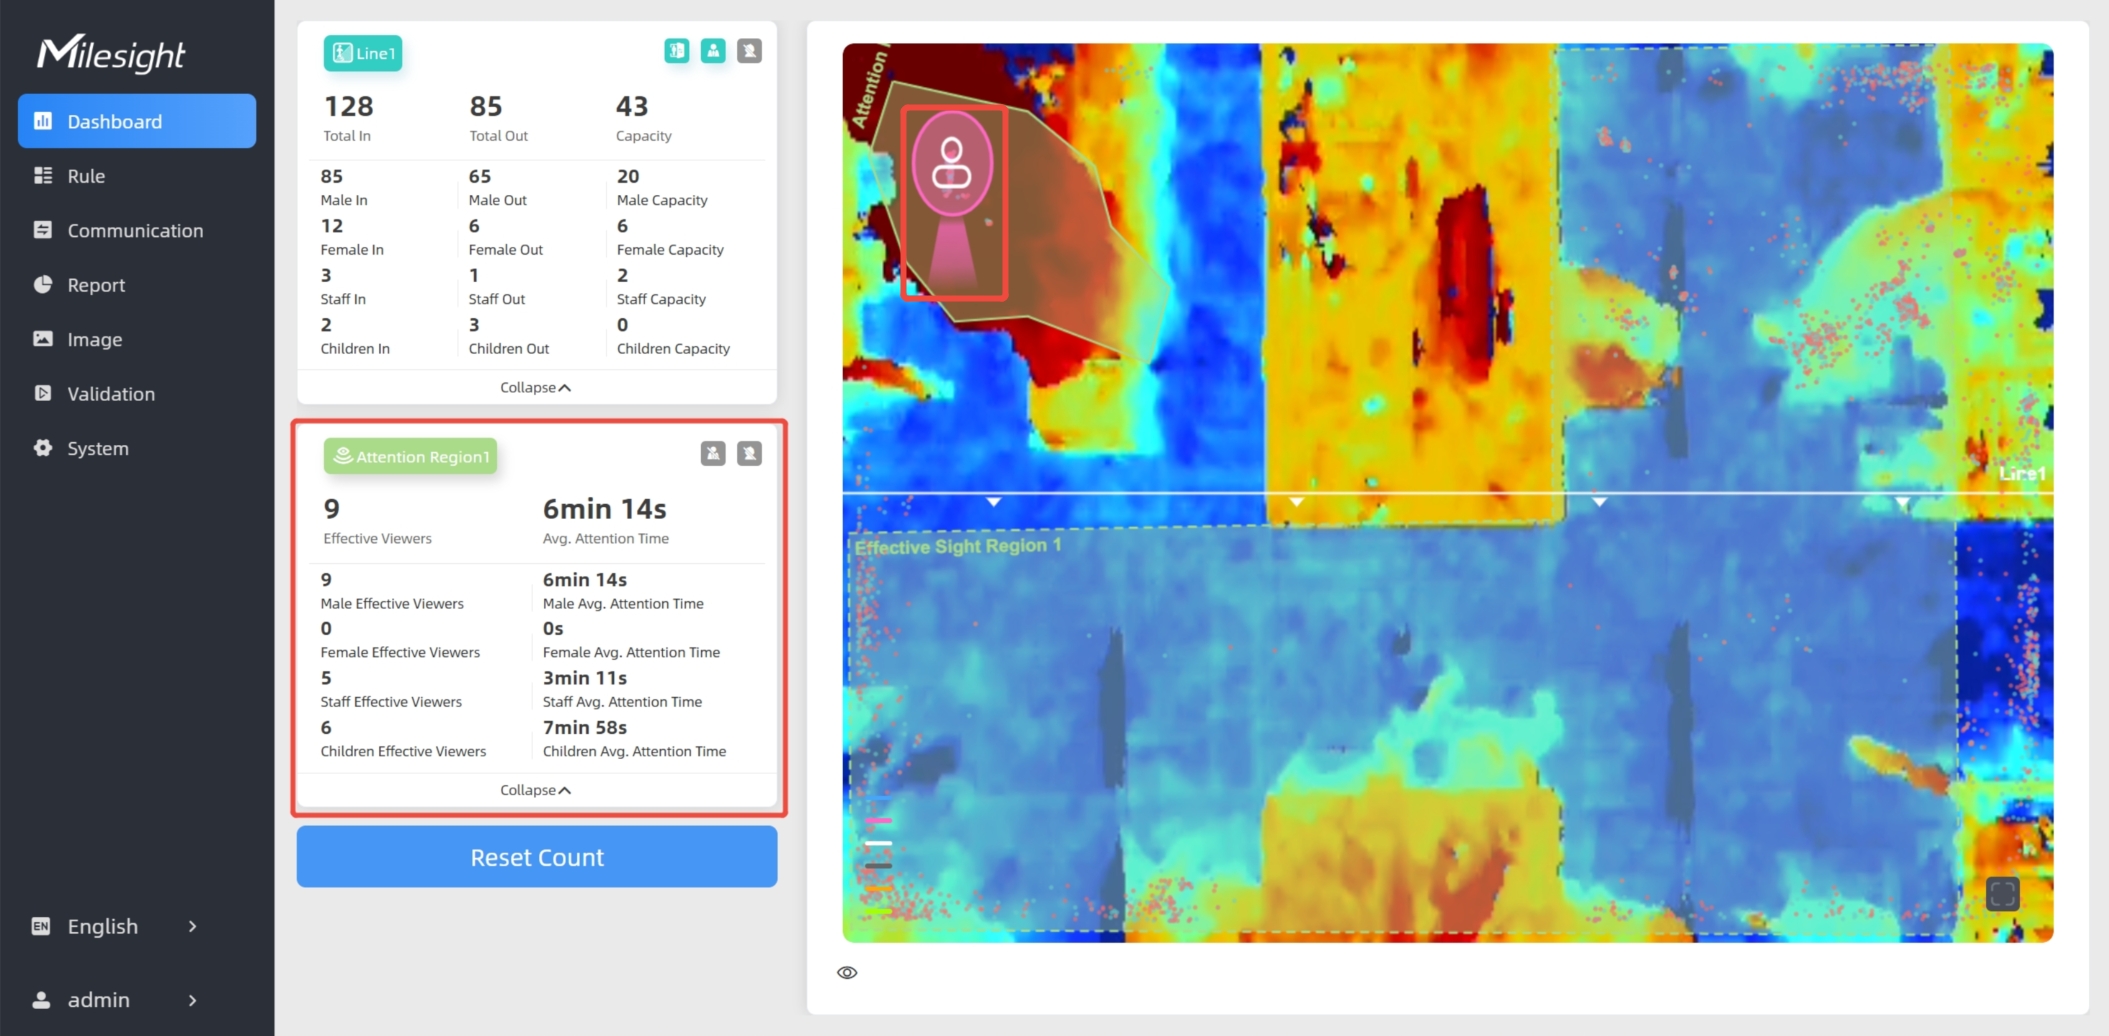
Step 1: Enable View Direction Detection, click +Add to drawing on the live view.
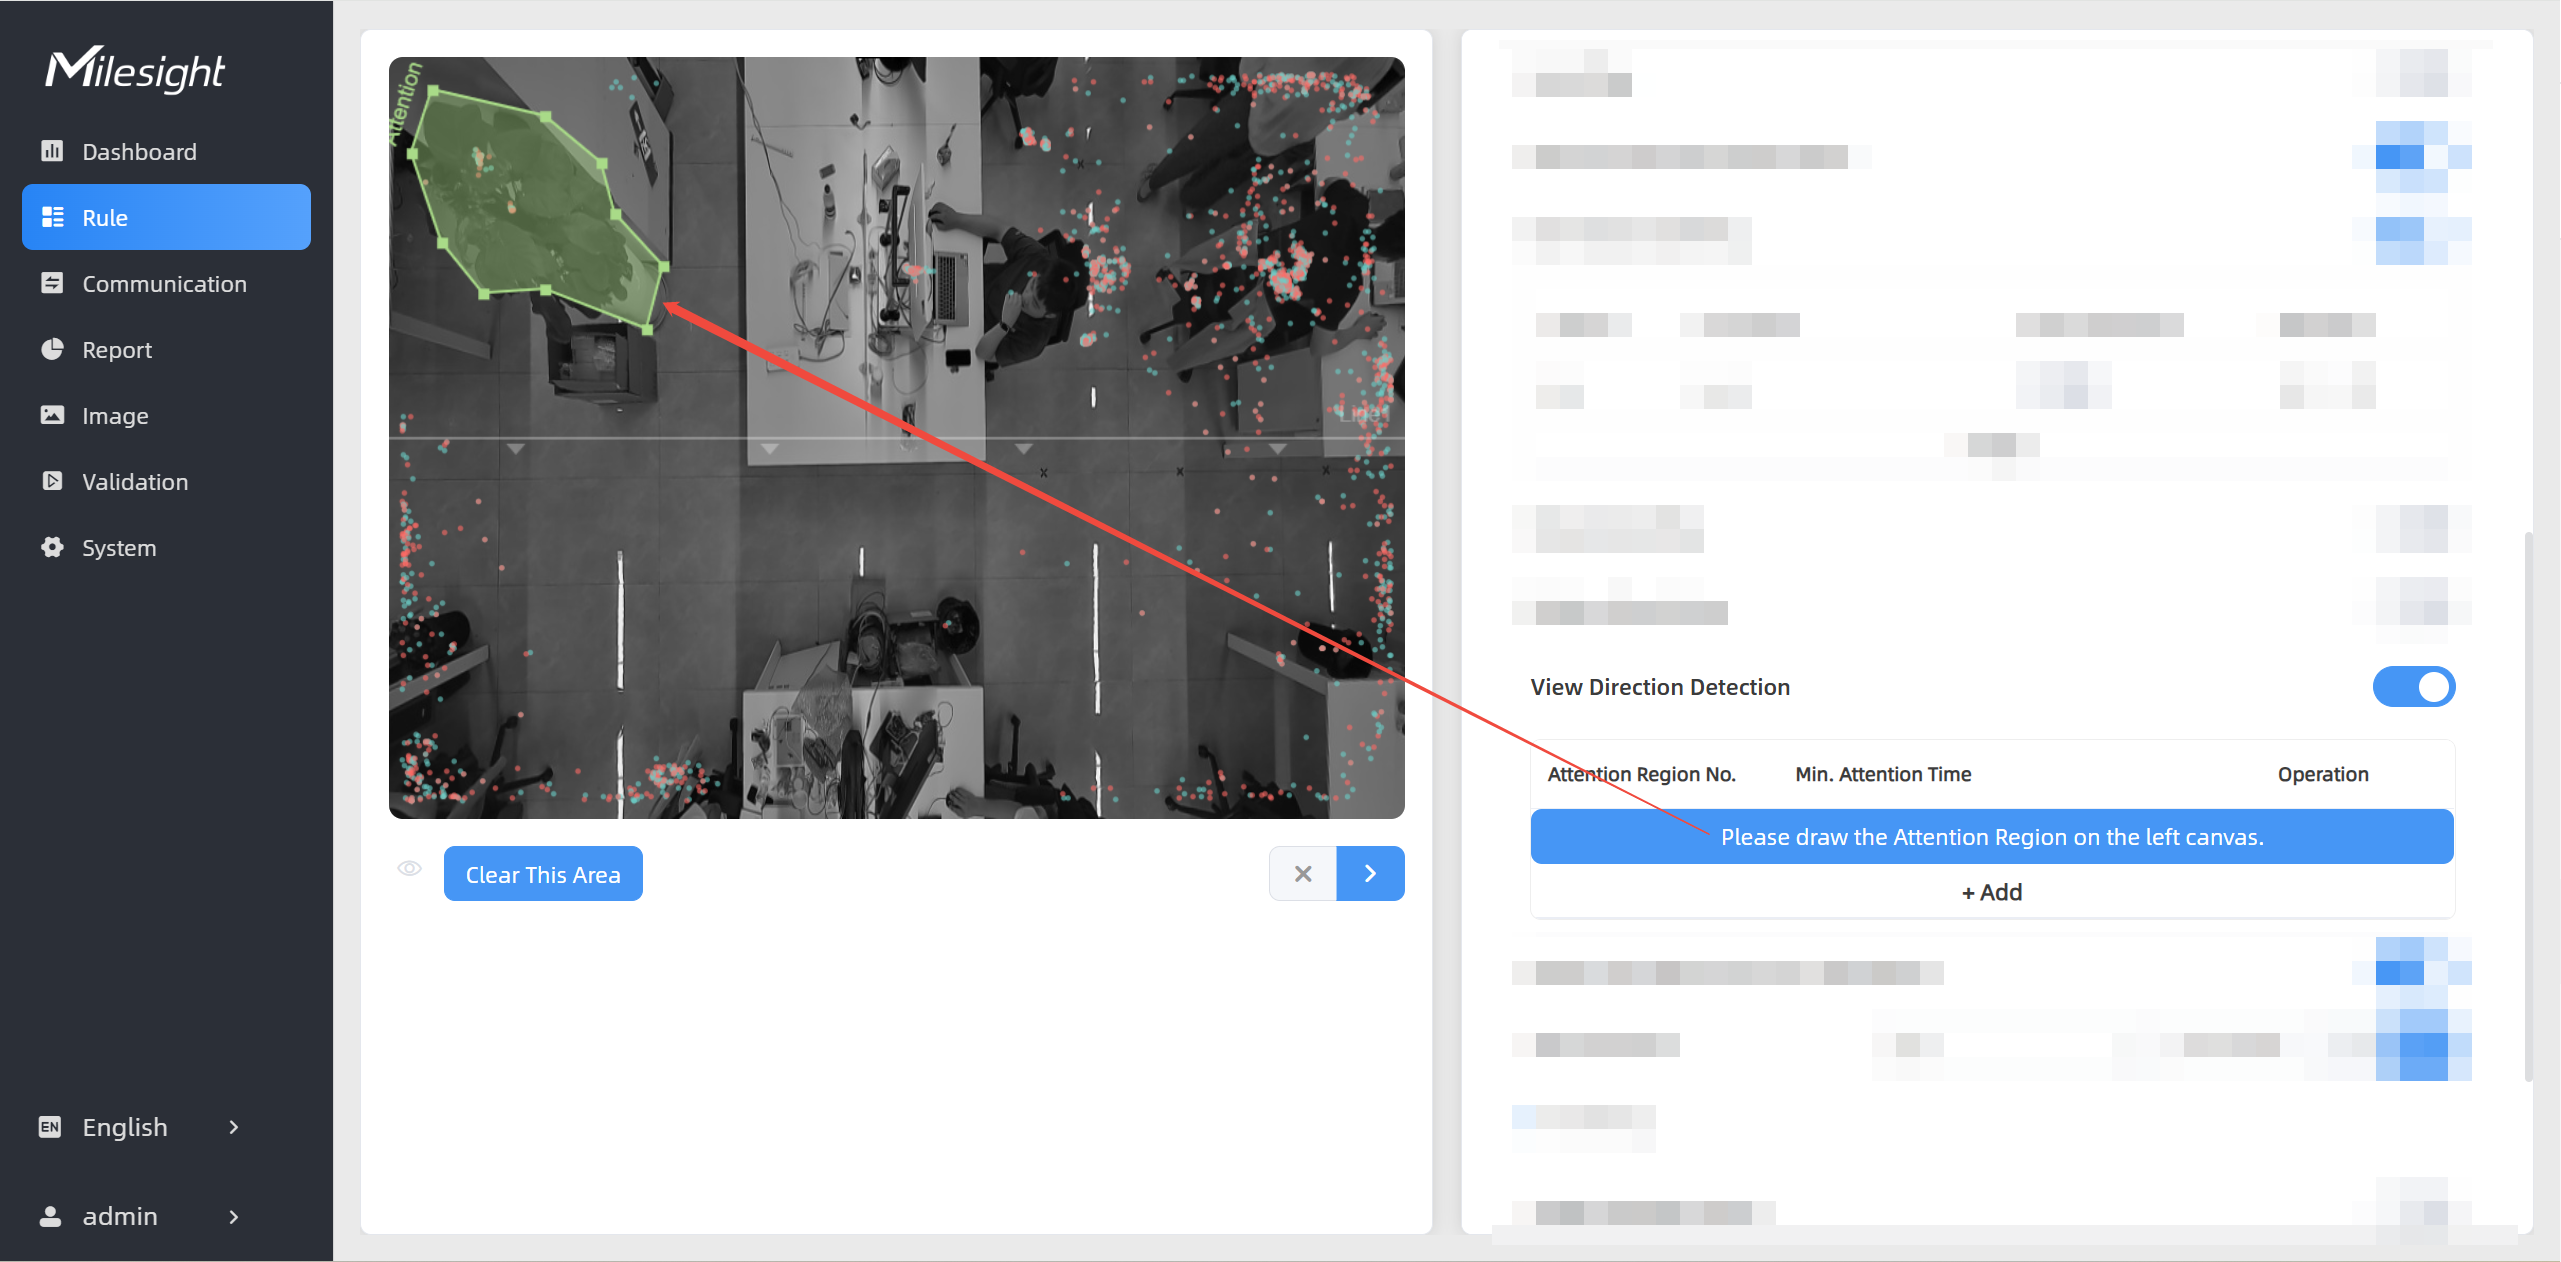
Step 2: Draw the Attention Region which requires attention to find out the effectiveness of such as billboards, new product displays, or shelves within.
Left-click to start drawing and drag the mouse to draw an edge. Then left-click again to
continue drawing a different direction edge. Right-click the mouse to complete the
drawing. The region can be dragged to adjust the location and length. One device
supports up to 6 regions with maximum 10 segments each. Then click ![]() .
.
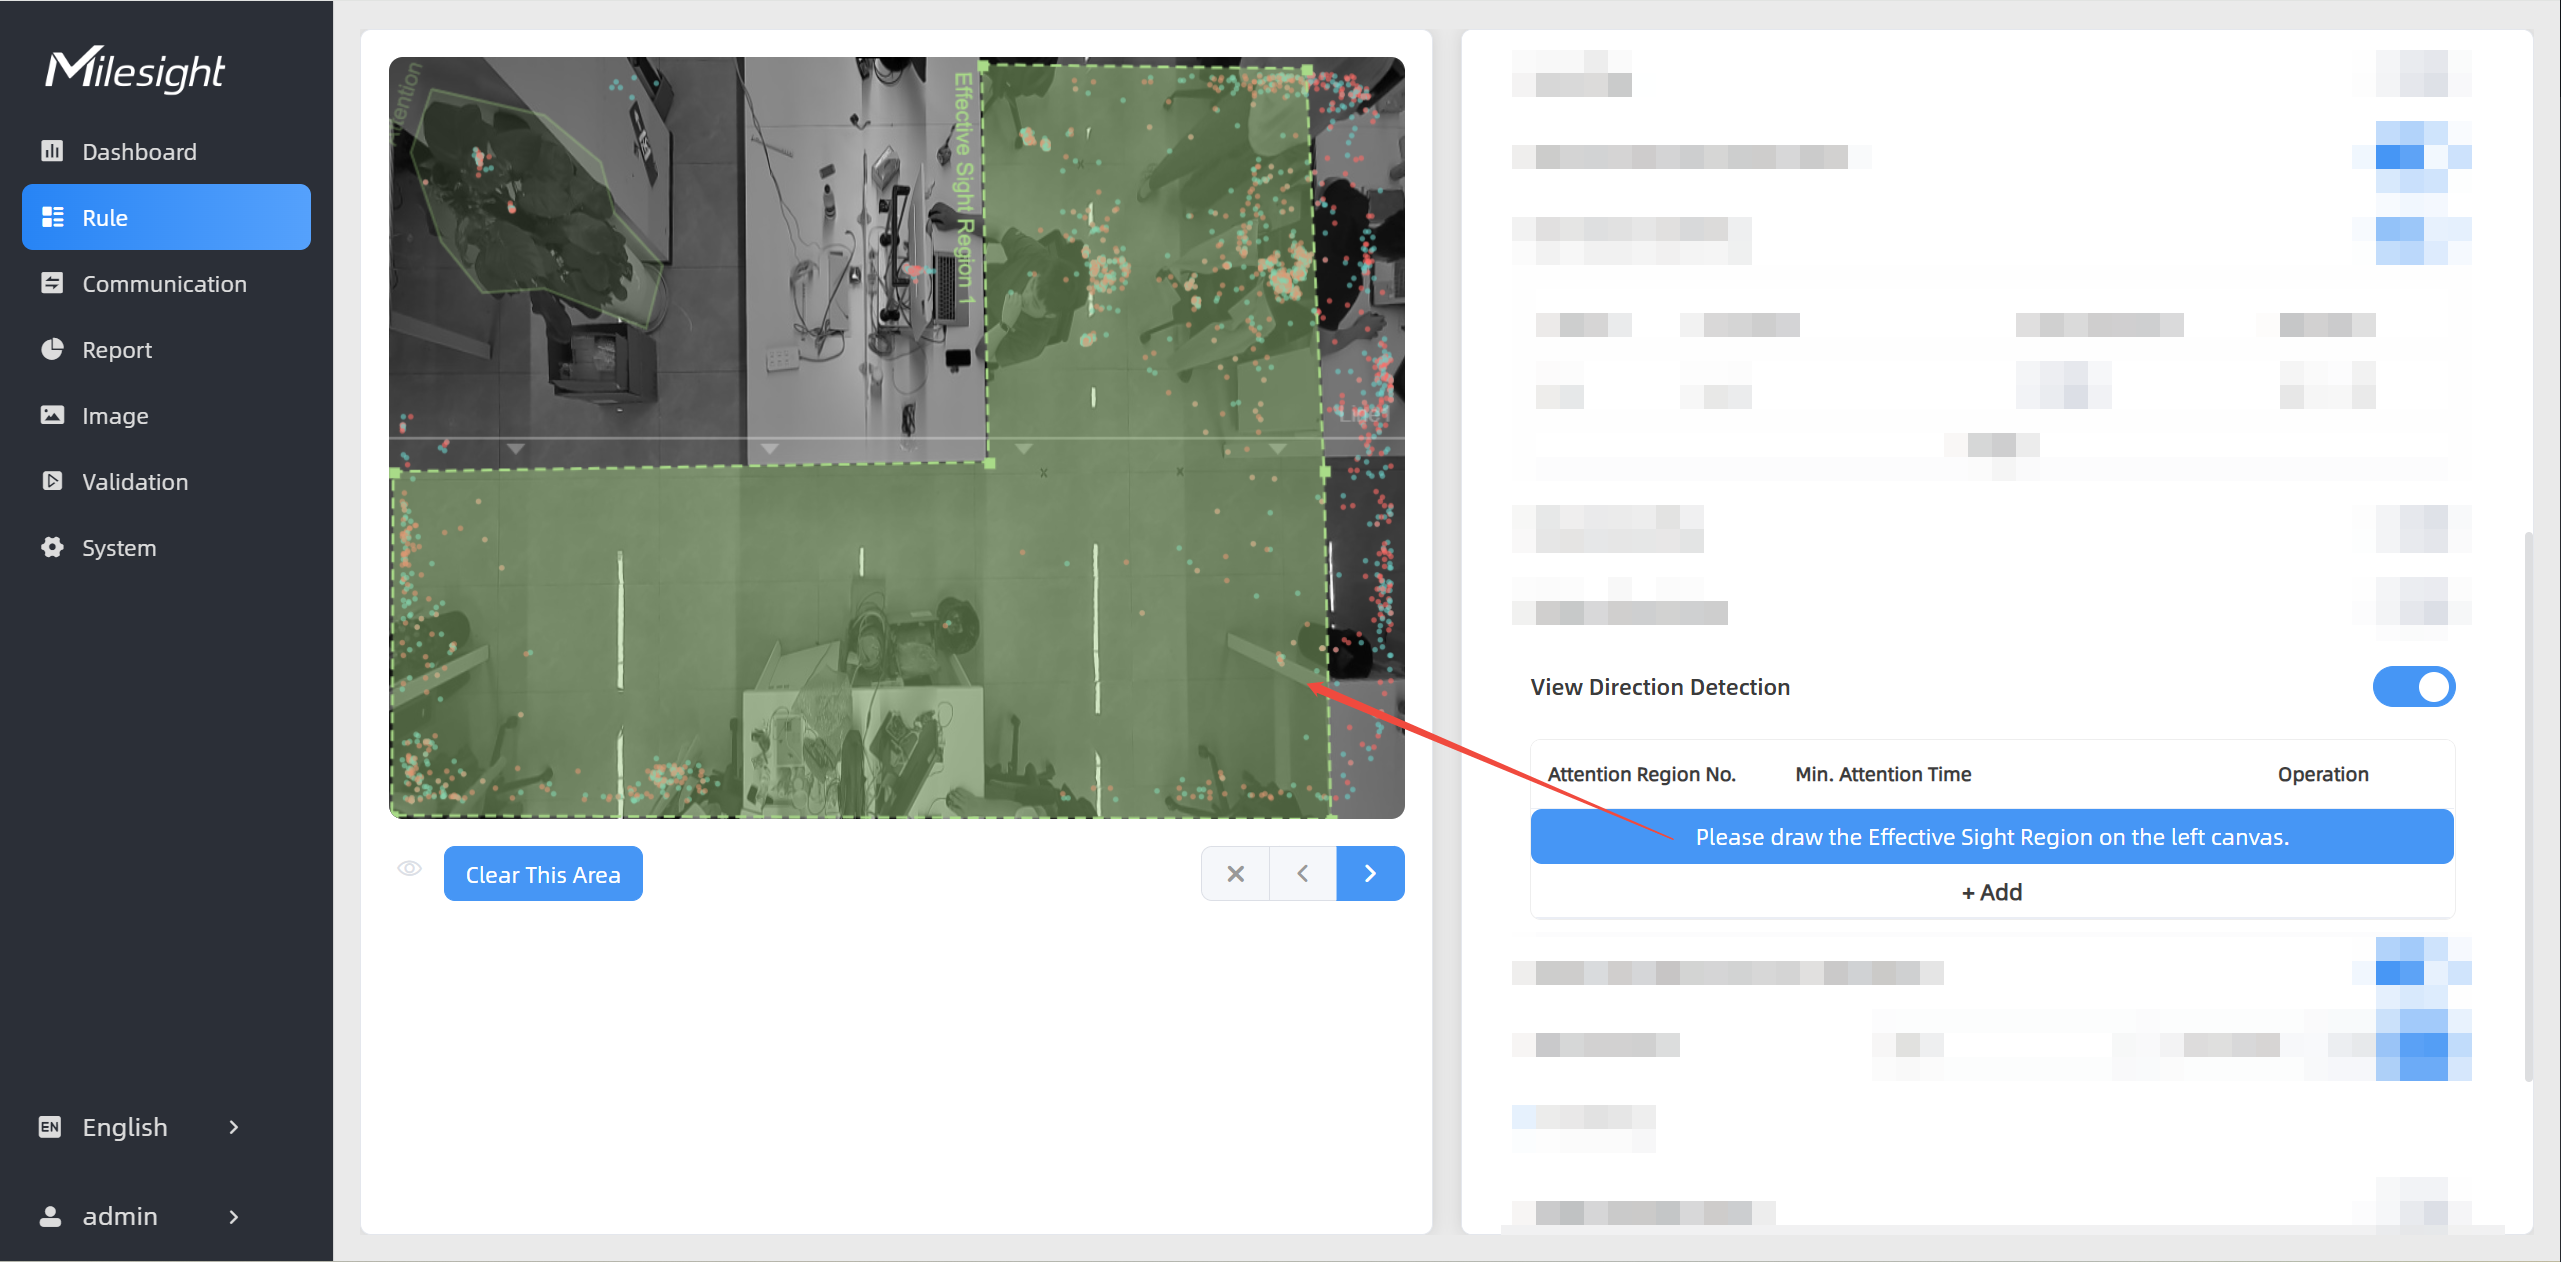
Step 3: Draw the Effective Sight Region. Within this region, the device analyzes the direction of the target's gaze, and if it overlaps with the Attention Region and remains there for more than 1 second, it begins to accumulate the duration of attention. If the line of sight moves out of the Attention Region, the timing is paused; when it overlaps again, accumulation resumes. Each device supports up to 6 regions, with a maximum of 10 segments per region.
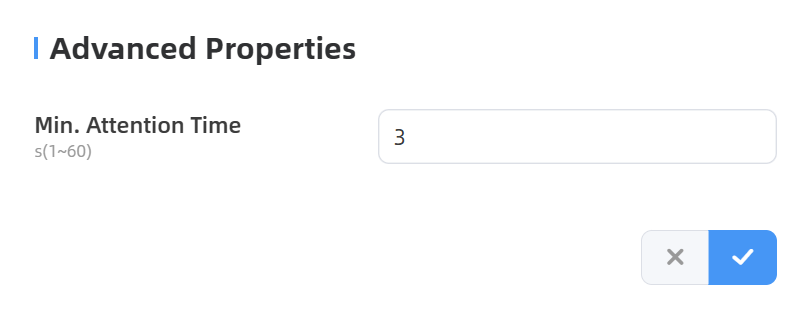
Step 4: Set Min. Attention Time. When the duration of the overlap of the target's
gaze direction with the Attention Region exceeds the set threshold, it will be
considered as a Effective Viewer. Click ![]() to
finish the configuration.
to
finish the configuration.
To view attention region's data for a certain time period and generate report, please refer to Report.
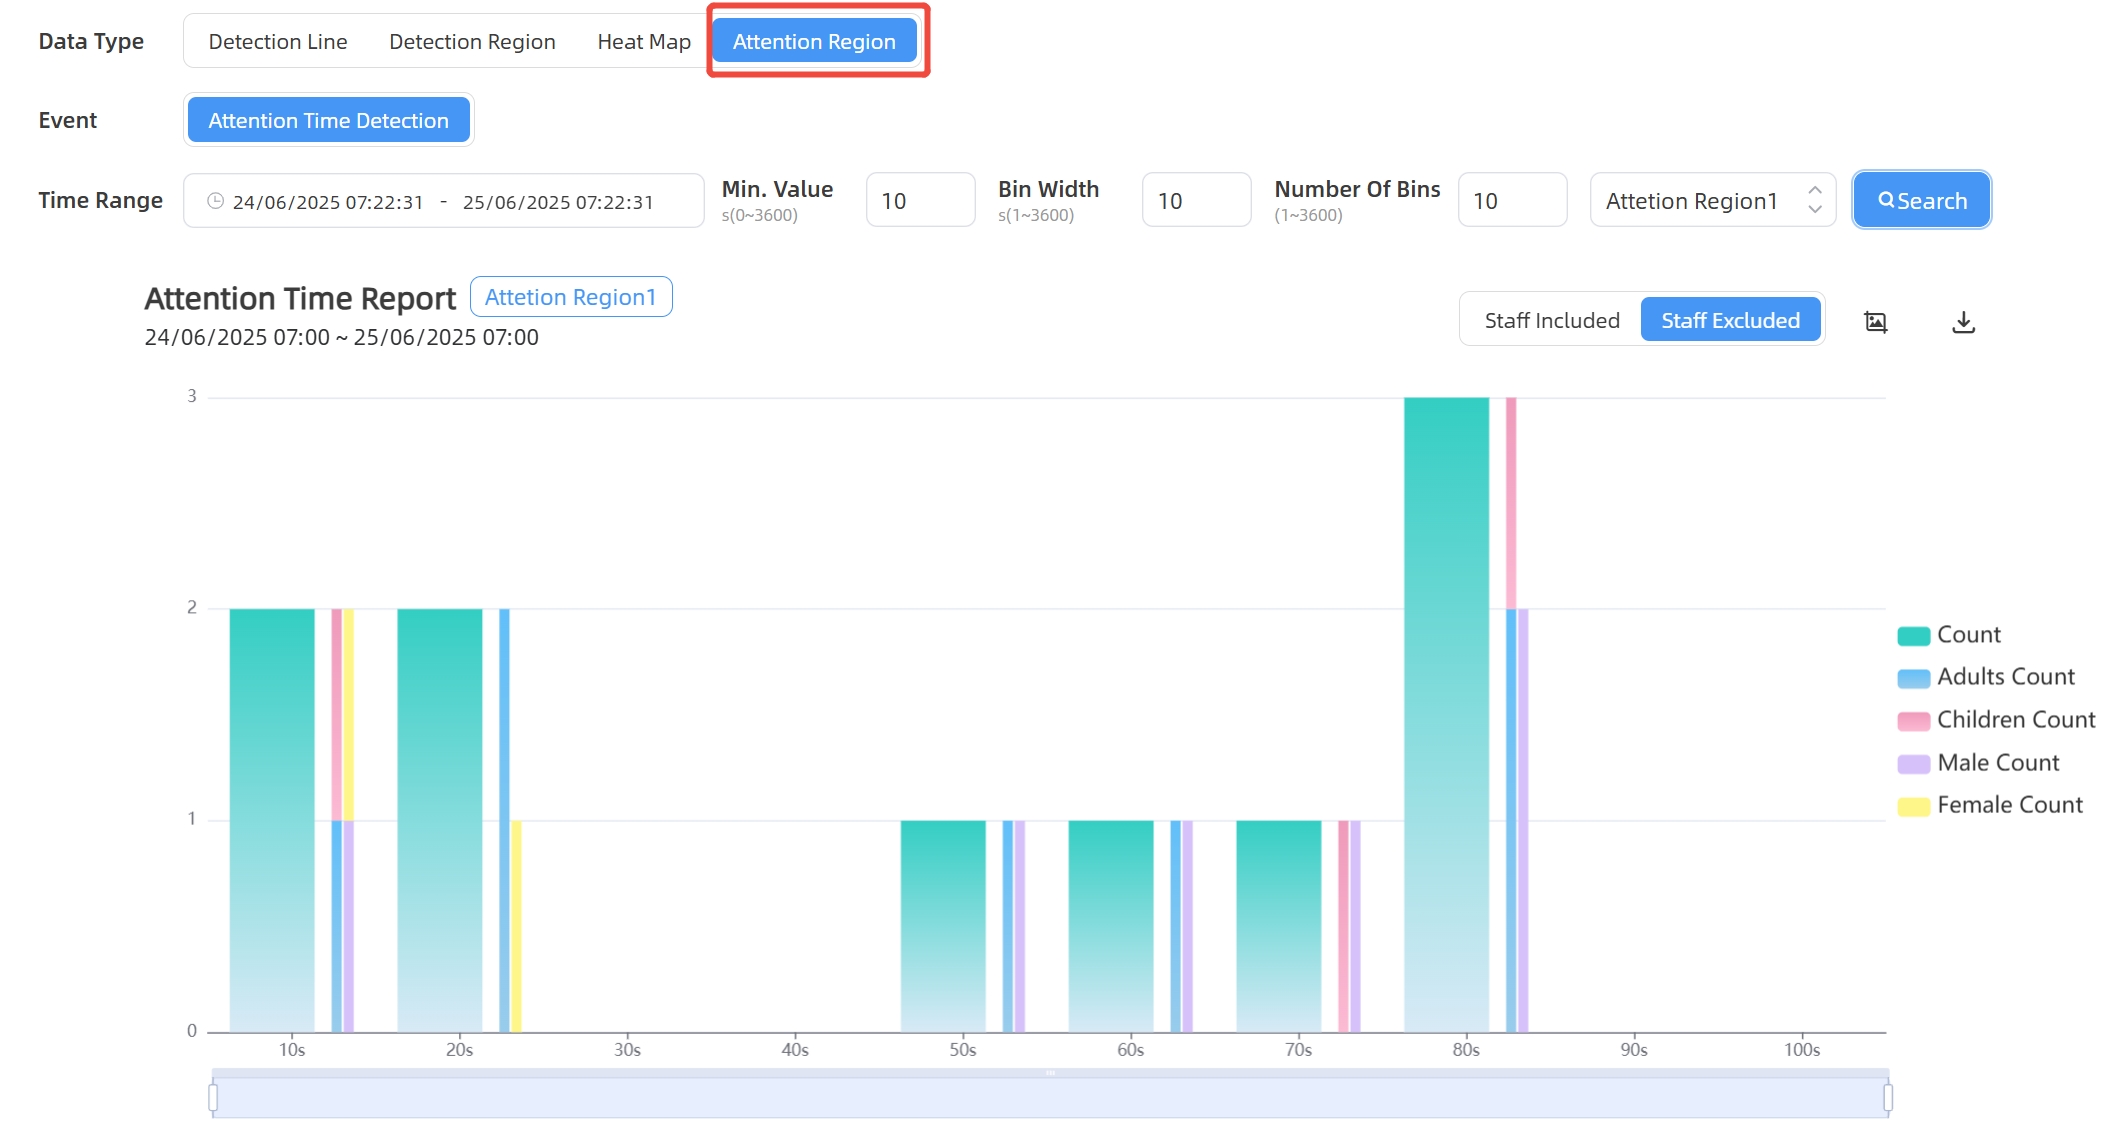
Users can also view "attention_region_total_data" in periodic report and "attention_region_trigger_data" in trigger report.